


 How fast are the coastal cliffs retreating inland? Which areas may be more affected in the future? Why are the cliffs in some areas eroded faster than those in others? And when and where will the next landslide happen? Most of us probably ask such questions when strolling on the beach beside the steep slopes of cliffs.
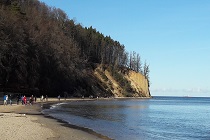
Geologists and geomorphologists, as well as other specialists studying the coastal zone, have attempted to answer these questions. We will highlight these problems using the example of the Orłowo Cliff located near Gdynia-Orłowo (Fig. 1).
Fig. 1. Orłowo Headland – the most familiar and central part of the Orłowo Cliff (view from the south)
The relationship between erosion and accumulation of sediment in the coastal zone is dynamic and undergoing constant change over time and space. It is defined by the geology, topography, availability of clastic sedimentary material in the shoreface, frequency and intensity of storms, rate of precipitation and groundwater flow in slopes. Human interference with the natural movement of sediment in the coastal zone, through installation of harbour breakwaters or coastal protection structures, can also intensify the negative sediment budget near cliffs. This in turn increases coastal erosion. Among the most important natural processes shaping cliff coasts are landslides. They are sudden displacements of earth masses along slip surfaces, driven by gravity (Fig. 2). They present significant risk to both coastal infrastructure and tourists who stay within their reach.
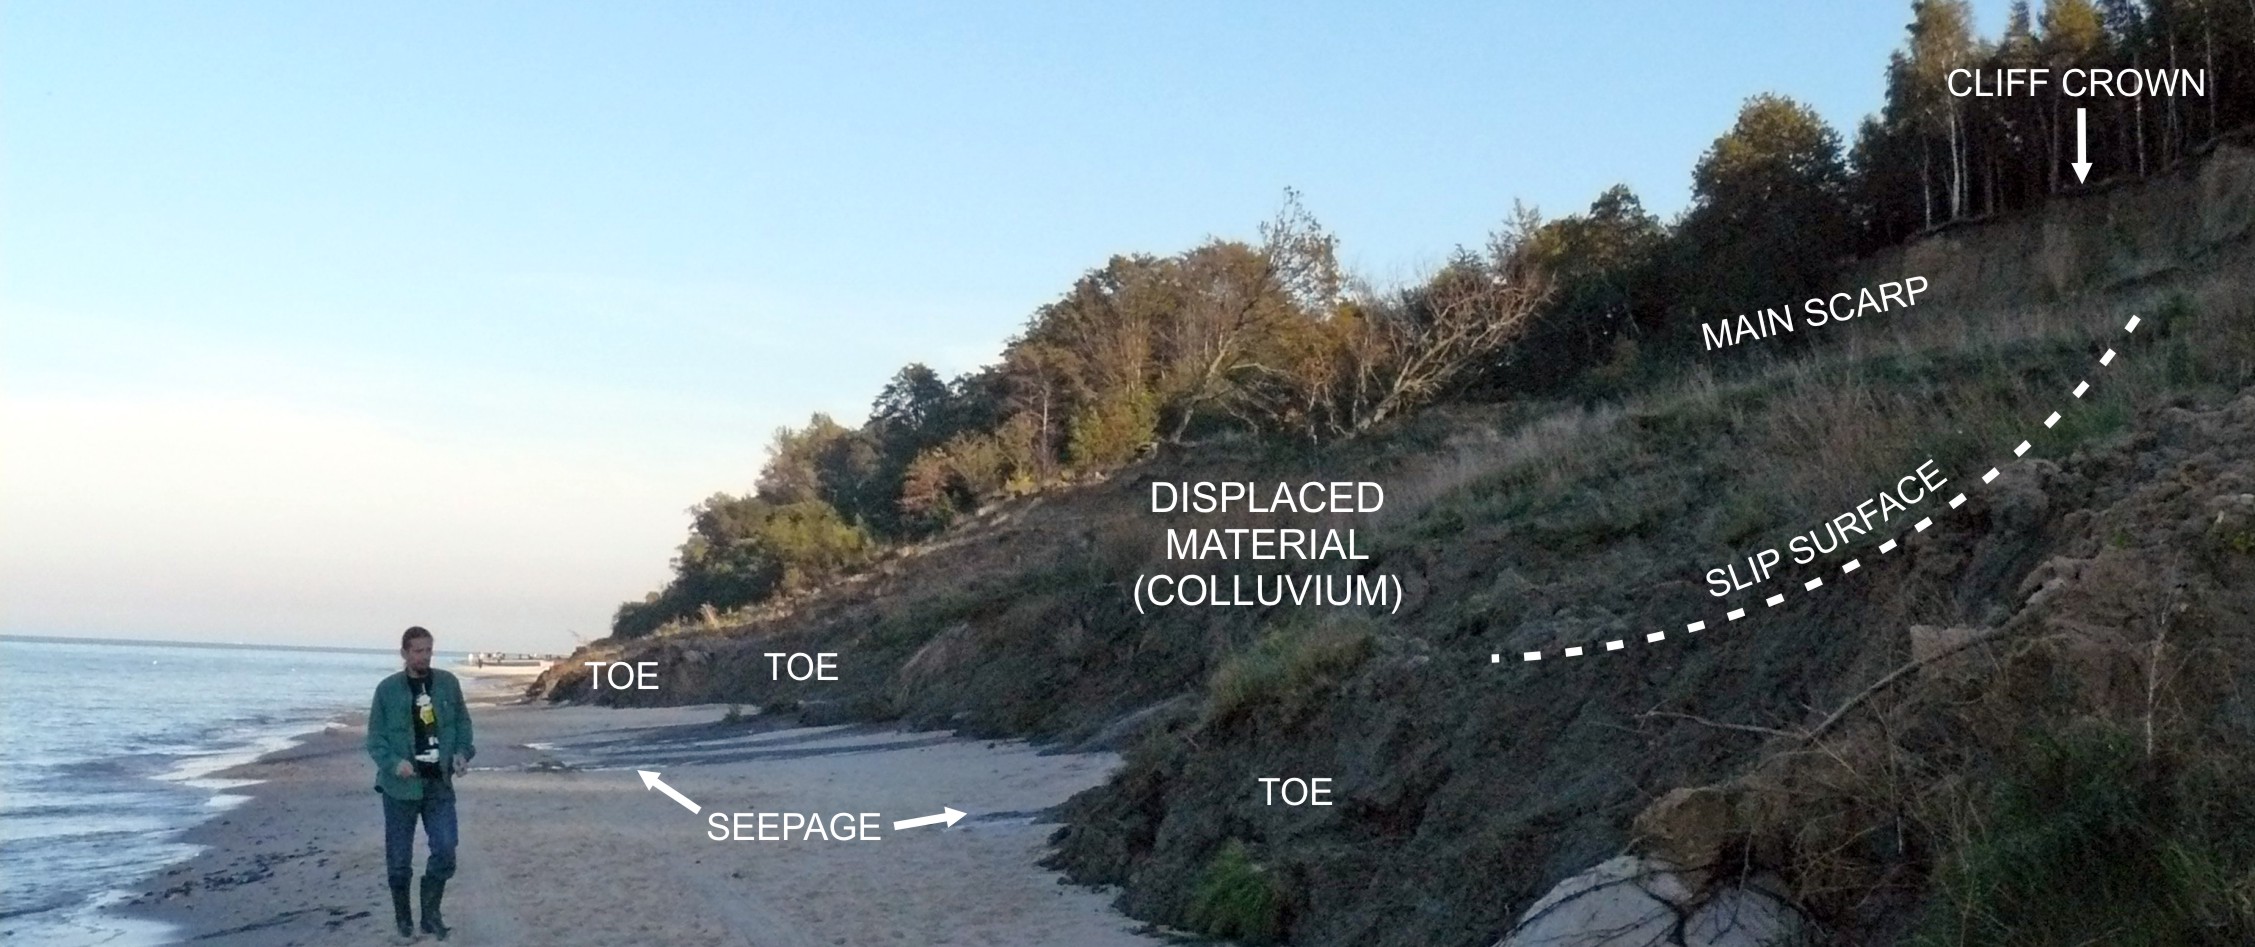
Fig. 2. Main components of landslide demonstrated on the cliff near Jastrzębia Góra
One of the tasks of the Polish Geological Survey (PGS) is to gather data about mass-wasting processes and hazards associated with them. This is carried out by the Polish Geological Institute – National Research Institute (PGI-NRI). At the coast, such data is collected using modern laser scanners by specialists from the Marine Geology Branch of the PGI-NRI in Gdańsk.
The Orłowo Cliff, which lies on the edge of the Kępa Redłowska Nature Reserve, is monitored using a ground-based Light Detection and Ranging (LiDAR) system. The same technique recently aided the discovery of a Mayan megalopolis in South America, ancient cities hidden in the jungles of Guatemala.
Laser scanning produces clouds of points (Fig. 3) creating spatial images of cliffs, which after filtration can be transformed into digital elevation models (DEM). When two such models from subsequent years are compared, the differences between them are displayed as an elevation difference model (multi-temporal DEM). It is interpreted as displacements of earth masses. Based on this interpretation, the amount of material which was transported, i.e. cut and fill budget, can be calculated.
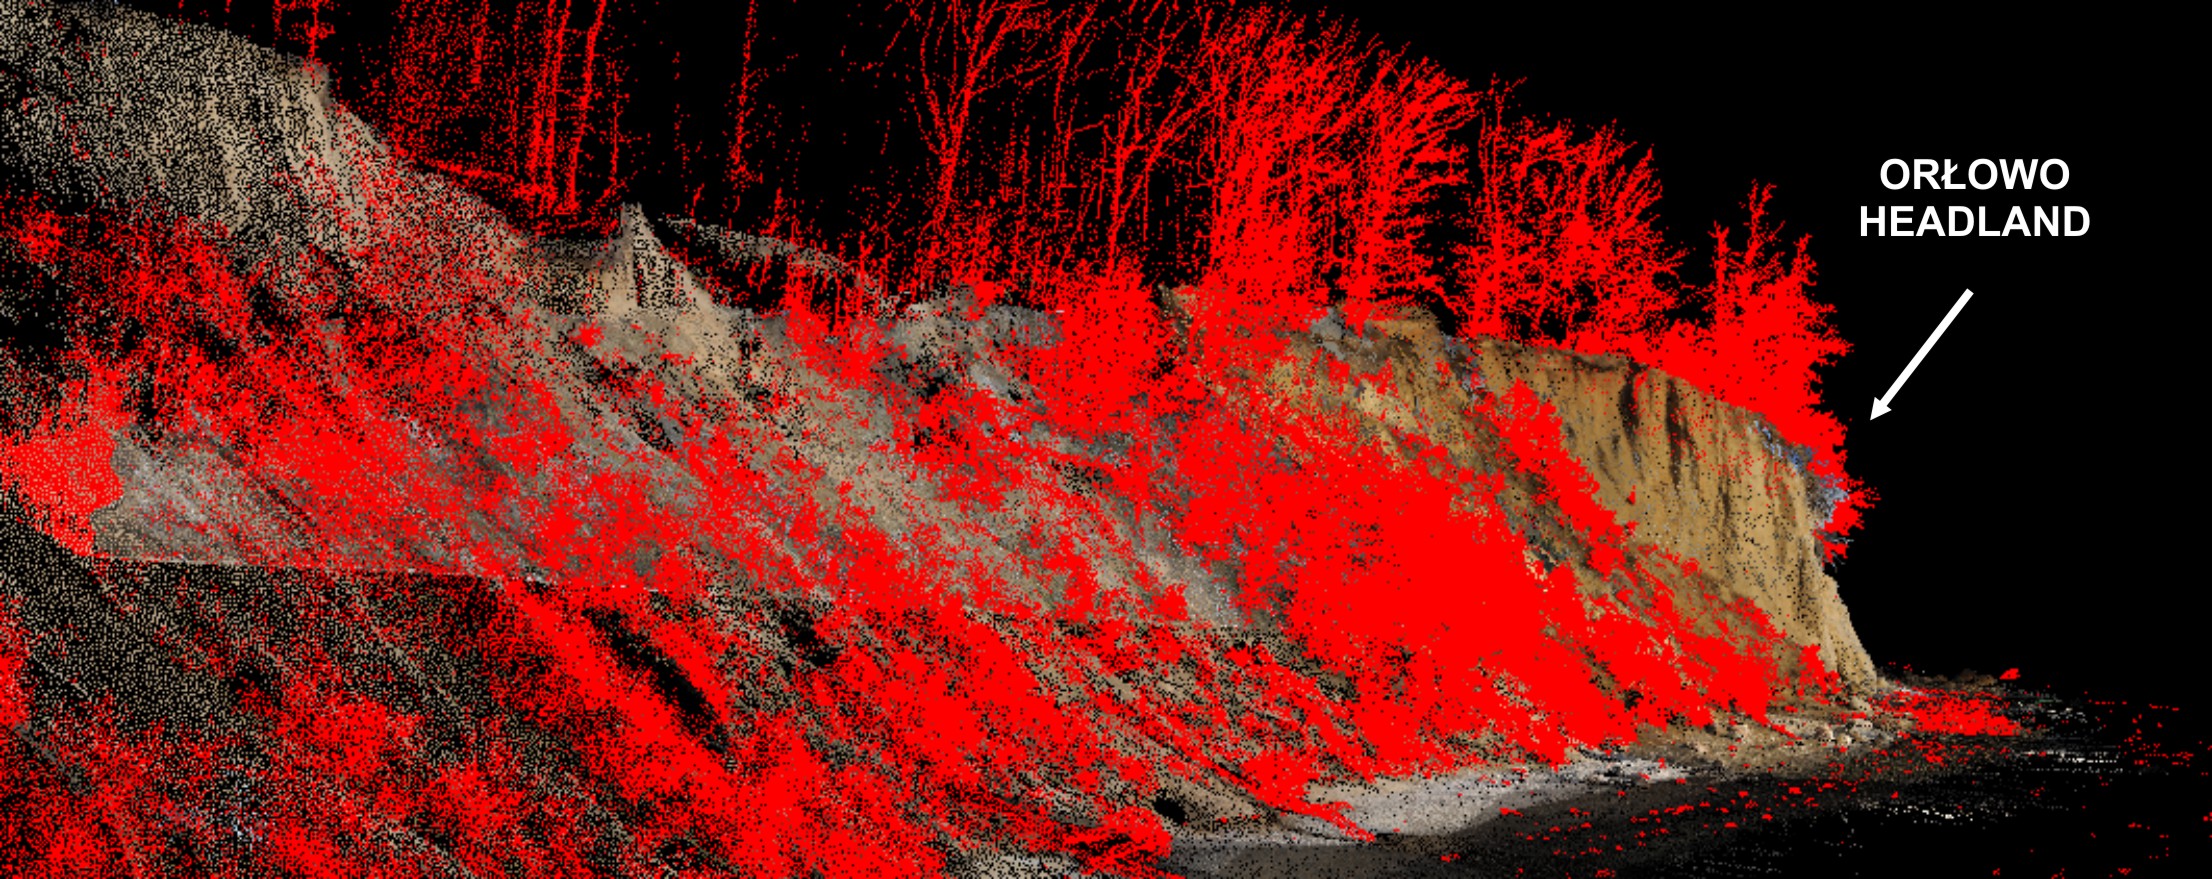
Fig. 3. Filtration of the point cloud from the southern part of the Orłowo Cliff; red indicates vegetation
The importance of regular data acquisition was demonstrated in mid-February 2018 when a new large landslide was activated at the Redłowo Tip in Gdynia-Orłowo (Fig. 4). Thanks to the historical data stored in the archives of the Marine Geology Branch of PGI-NRI in Gdańsk and the data collected in February 2018 immediately after the landslide, an elevation difference model could be created.
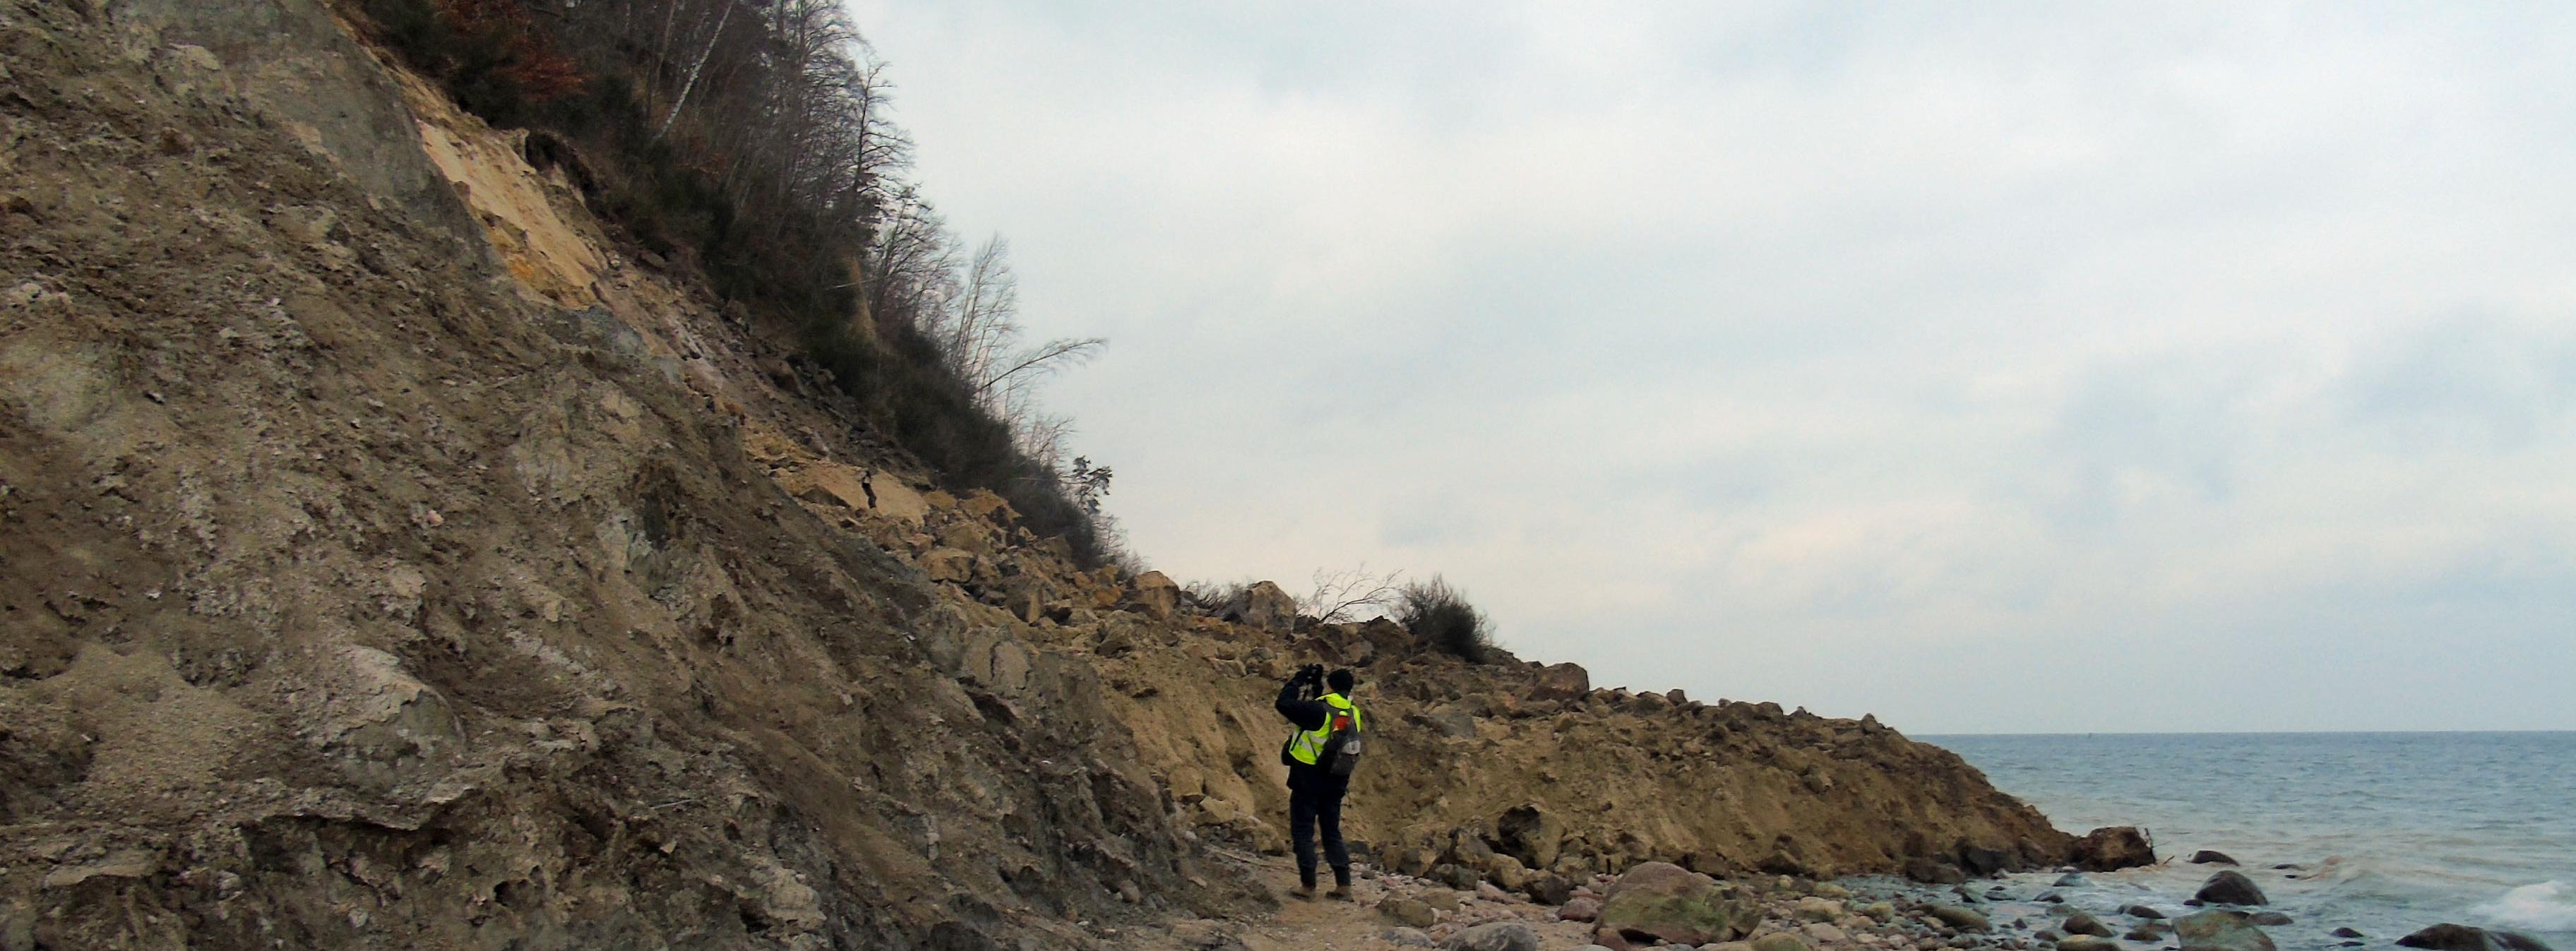
Fig. 4. Landslide colluvium crossing the beach behind the Redłowo Tip (landslide No. 2 in Fig. 5) (14/2/2018)
The model presented in Fig. 5 shows a series of landslides on the northern side of the Redłowo Tip. The three big landslides are numbered 1 to 3, while a smaller slump further to the north indicated by number 4. The first landslide (1) started in Autumn 2017. Its crown receded inland by up to 5 metres (Figs. 5 and 6).
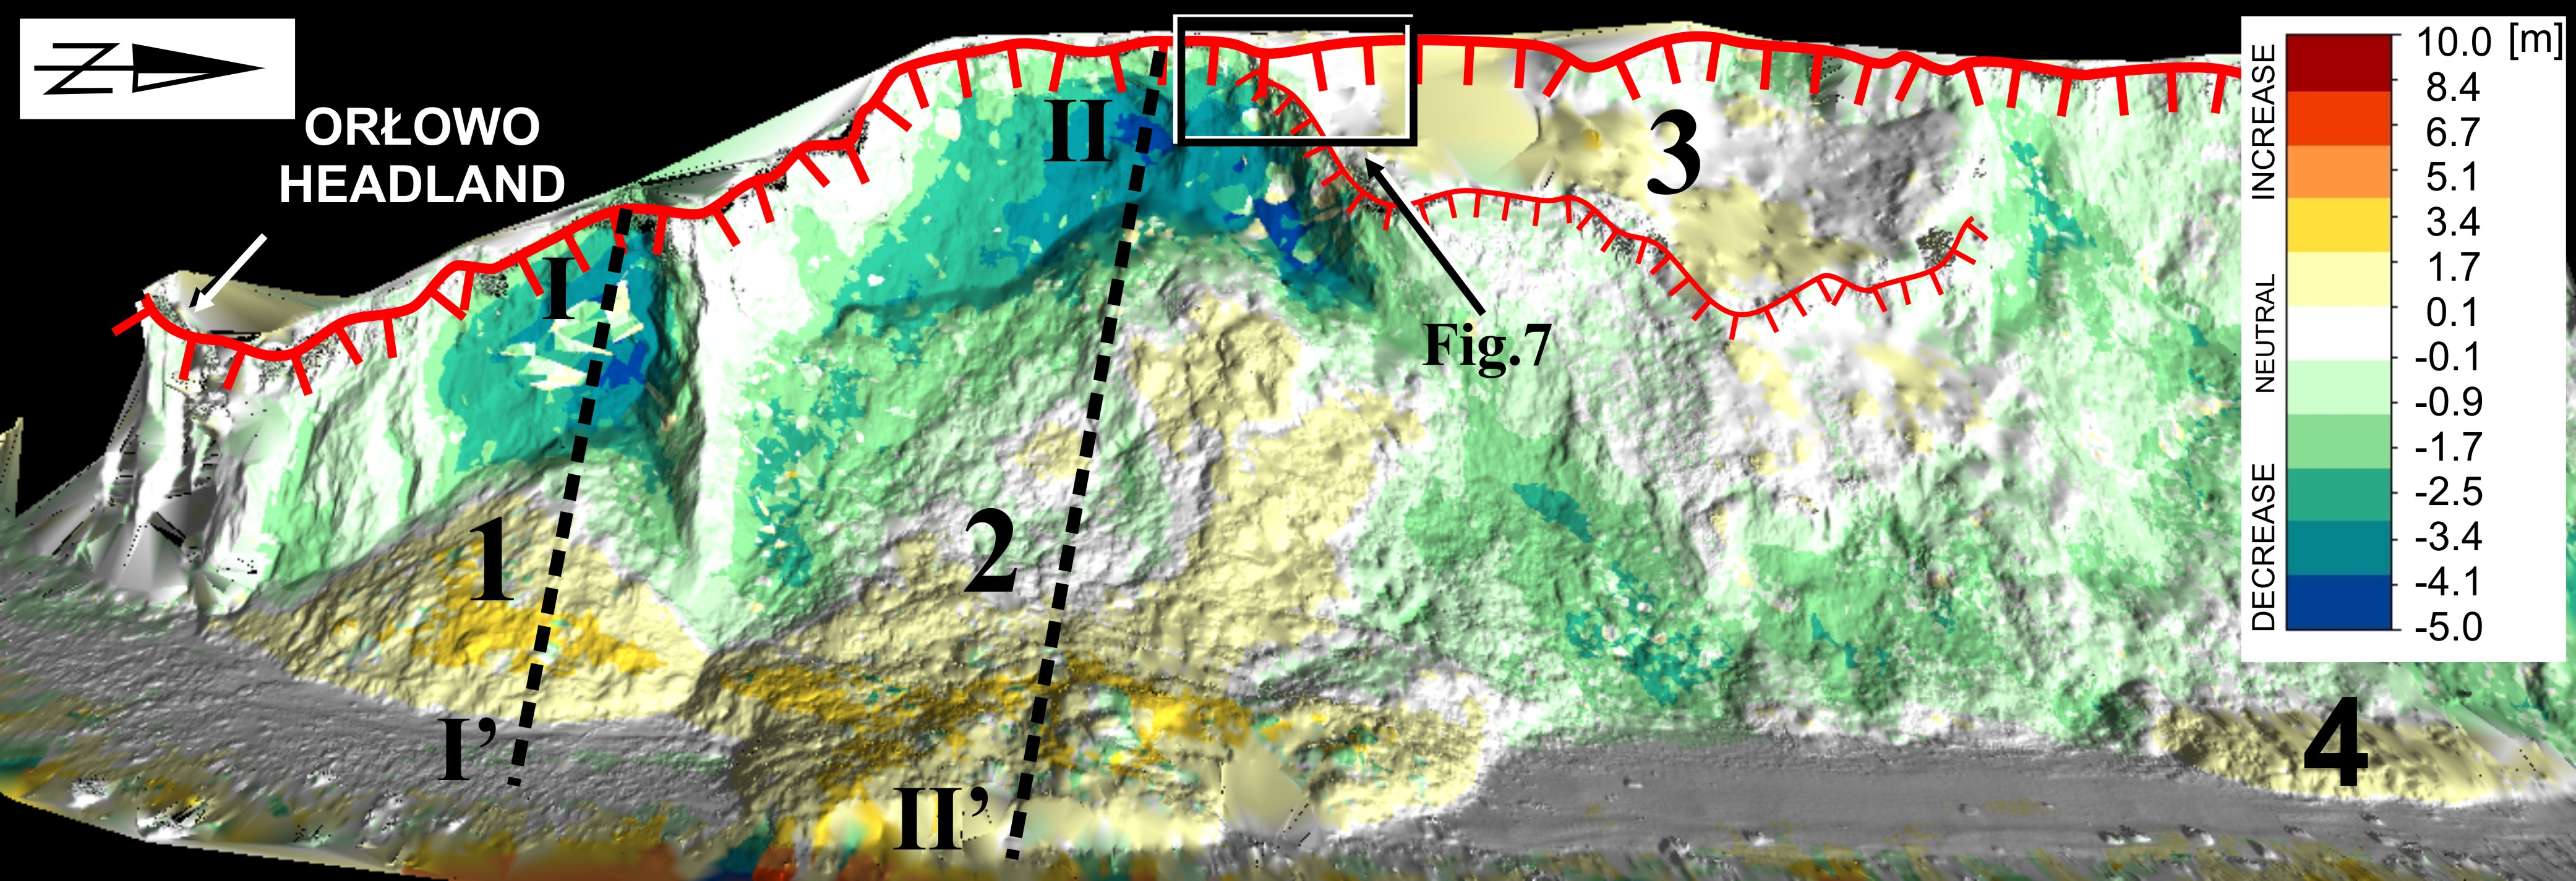
Fig. 5. Elevation difference model of the northern part of the Orłowo Cliff based on LiDAR data collected in April 2016 and February 2018. Thick red line indicates the location of the cliff crown (edge of the main scarp); thin red line represents the edge of the secondary scarp of landslide No. 3.
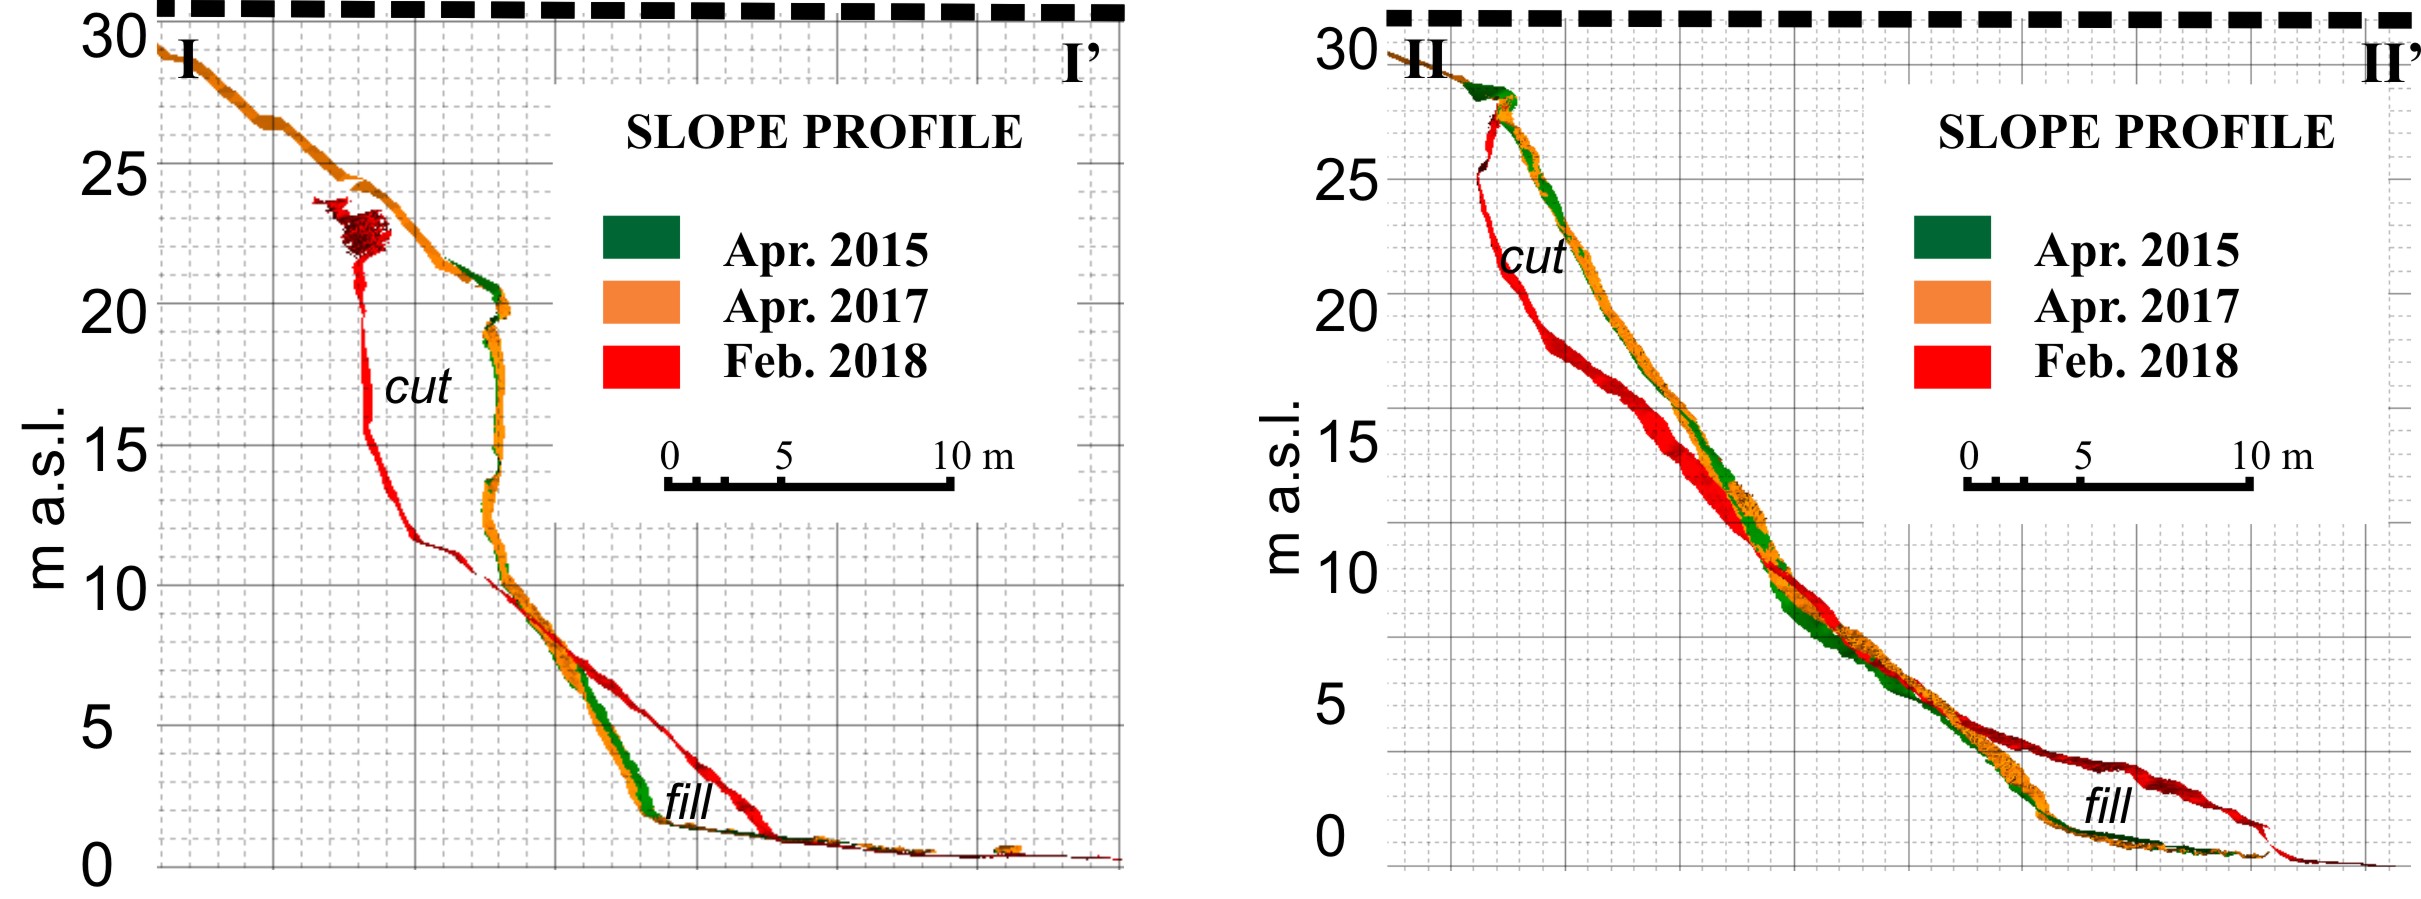
Fig. 6. Slope profiles developed using ground-based laser scanning from the Orłowo Cliff: left – section I-I’, right section II-II’
In total, 770 m3 of soil, mainly glacial till, was moved when compared with the situation from April 2017. This includes 520 m3 of material removed from the upper part of the cliff and 250 m3 of soil deposited as colluvium at the foot of the slope.
The second landslide (marked 2 in Fig. 5), which started in February 2018, had a much larger extent (Figs. 4 and 5). Its northern edge is marked by the contact zone between the glacial till and sand and silt deposits (Fig. 7). Its southern extent is limited by the glacial till of the Redłowo Tip. The colluvium, including the material from the upper part of the cliff, crossed the beach, reaching several metres into the sea. The edge of the main scarp, however, did not change; the till that slid down was originally located below the cliff crown. Thus a steeper slope was created (Fig. 6). Estimates show that in total 2690 m3 of Pleistocene deposits were moved, including 1790 m3 of material cut from the upper part of the cliff.
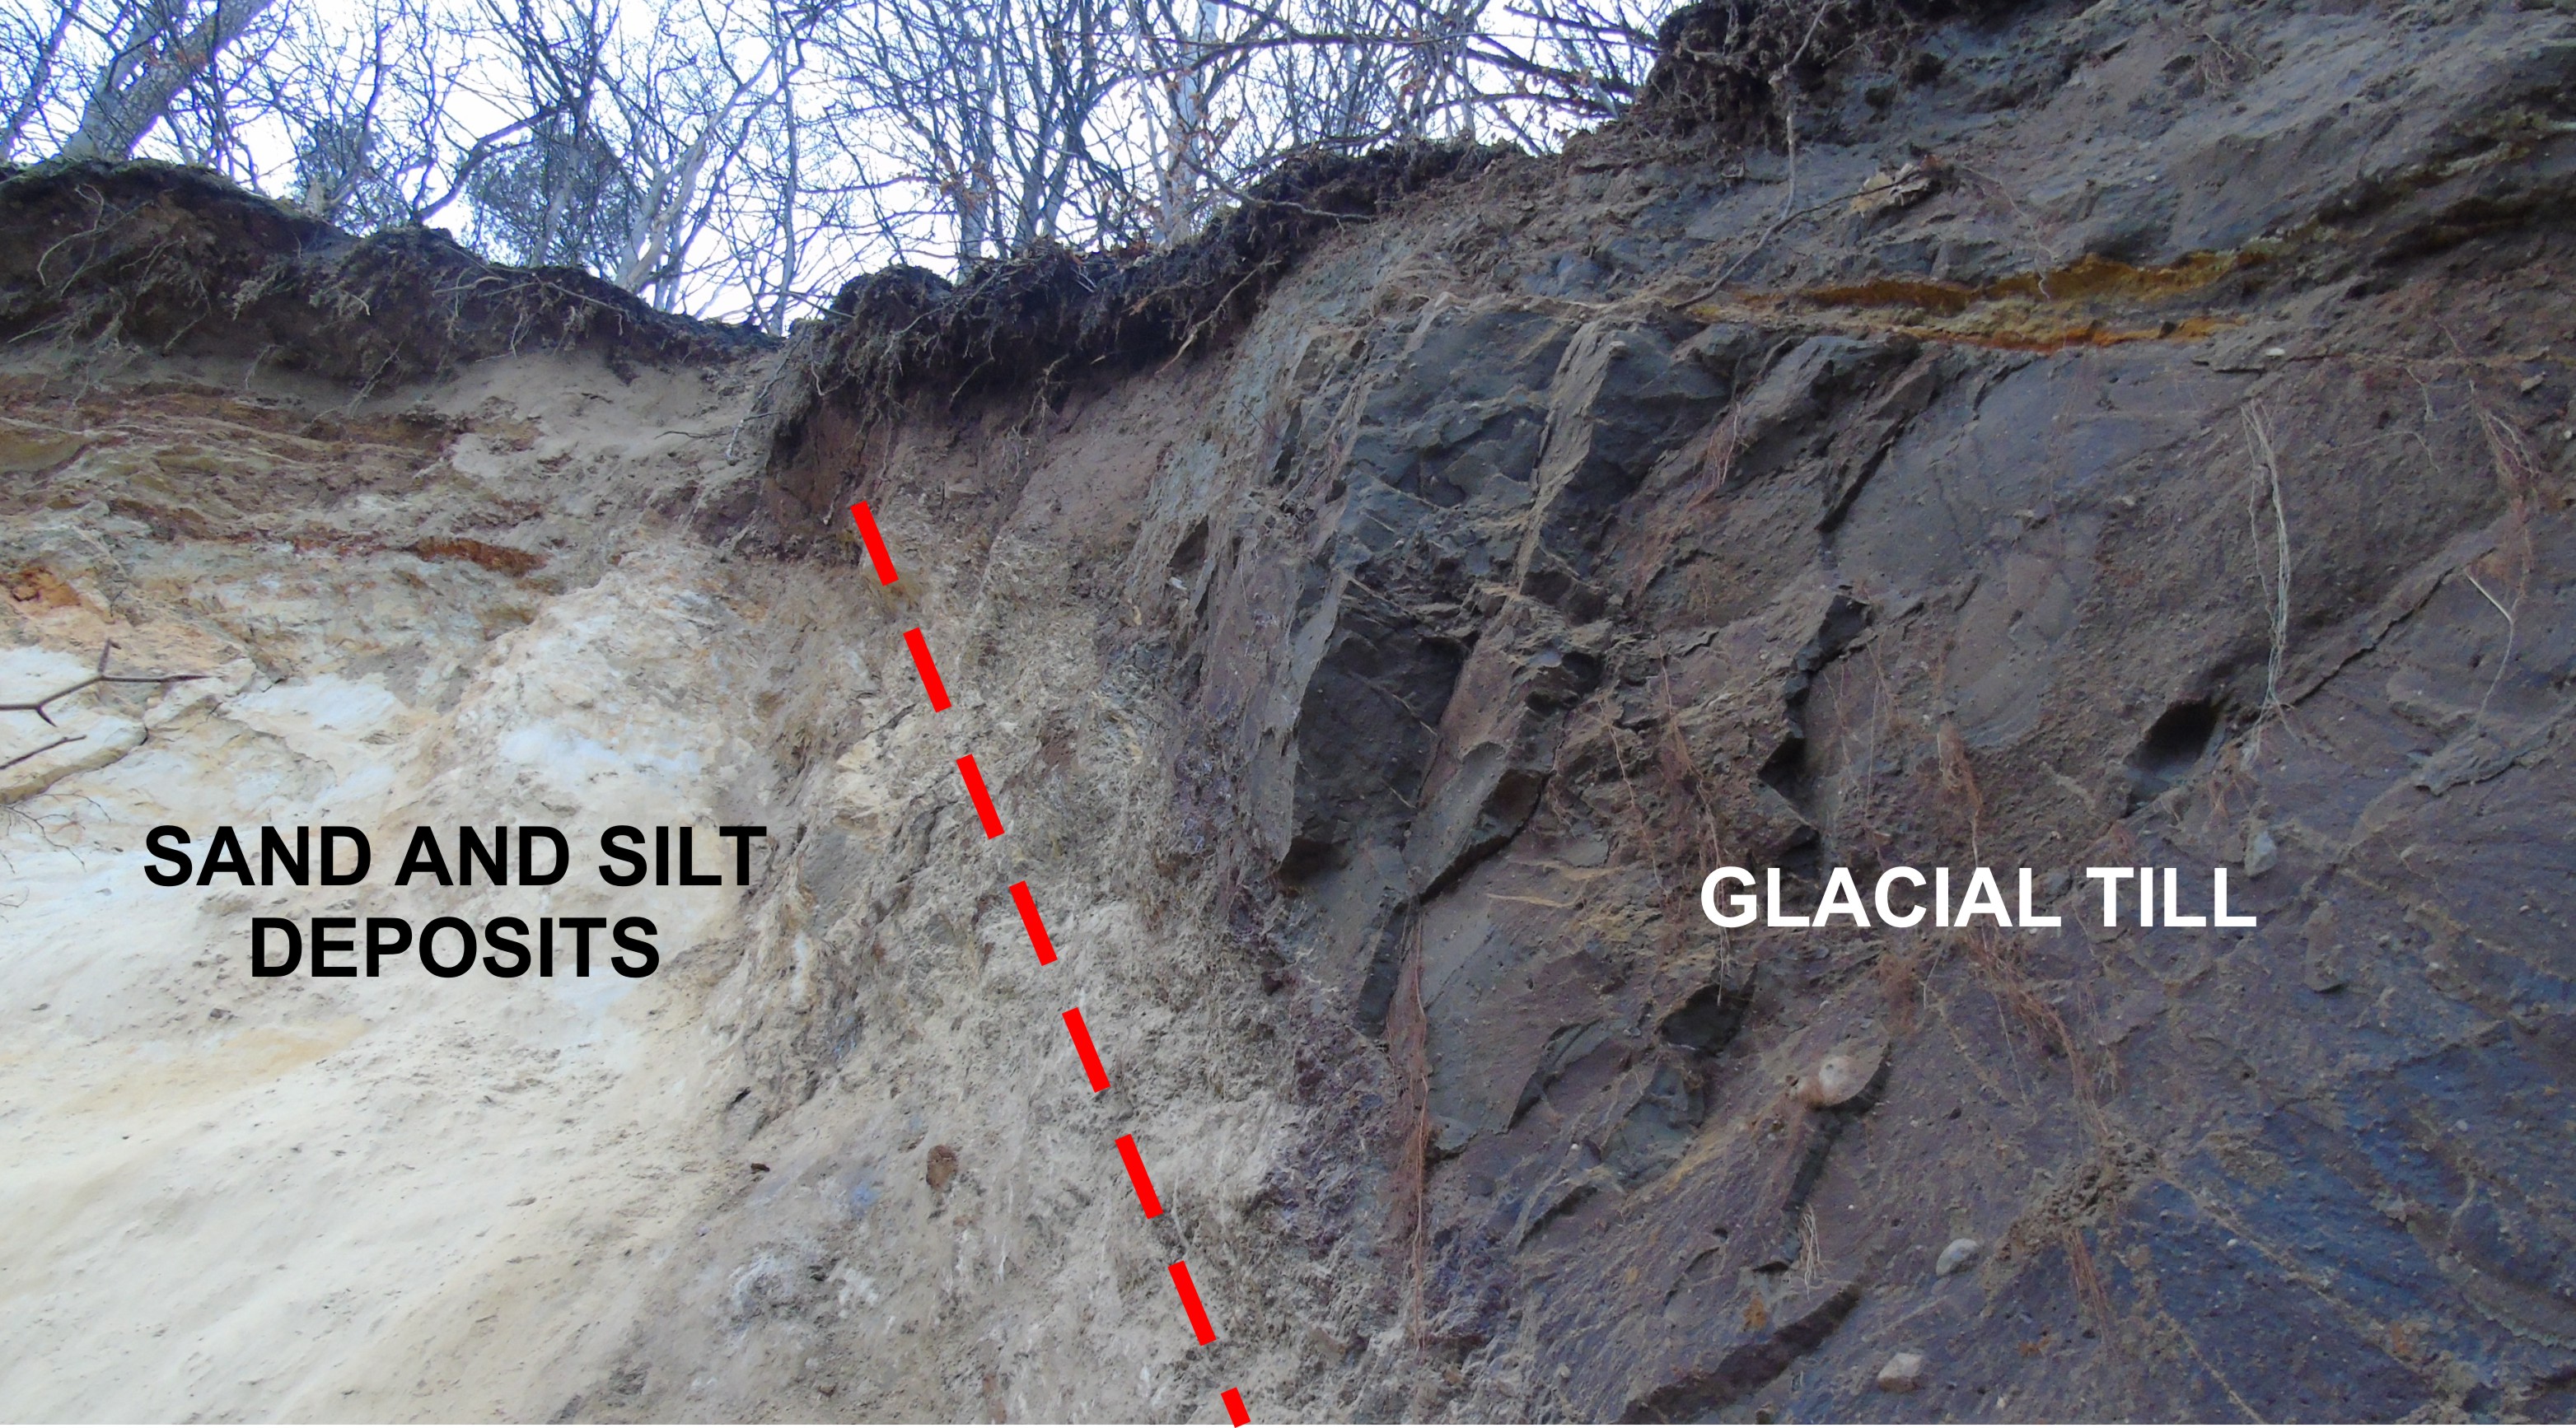
Fig. 7. Contact zone (marked with red line) between the glacial till and sand and silt deposits in the upper part of the cliff, i.e. the northern boundary of landslide No. 2 (14/2/2018)
The third landslide (marked 3 in Fig. 5) started before 2010, with the earth mass sliding along a cylindrical slip surface. Because recent years have brought very few changes, the 5-metre-high main scarp created by that event is still visible.
LiDAR monitoring started in 2010, and by 2015 the slope of landslide No. 3 became steeper while its secondary scarp receded inland. Between 2015 and February 2018, the slope remained relatively stable. The area of landslide No. 3 should be considered the most hazardous to people who stay on the beach section which is located immediately to the north of the Redłowo Tip.
The slope marked 4 in Fig. 5 is currently a small slump, and is clearly smaller than the other three.
Studies carried out by the PGI-NRI also determined the speed of the landward retreat of the Redłowo Tip, particularly its upper edge, which receded at an average rate of 0.23 m/year (calculated using the method by Frydel et al. 2017) during the period 2010–2015 (Małka et al. 2017).
Recently, the PGI-NRI completed the Pilot Study of 4D Mapping of the South Baltic Coast. During this project, the starting point for a much wider programme (Fig. 8) was created. The objectives of the new programme include mapping the geology of the whole Polish coast, both onshore and offshore, determining geohazards associated with this zone and forecasting its future evolution. Understanding the geology of the coastal zone and its vulnerability to mass-movement processes will allow us to manage it in a more sustainable way. The project will also bring us closer to answering the questions we asked at the beginning of this text.
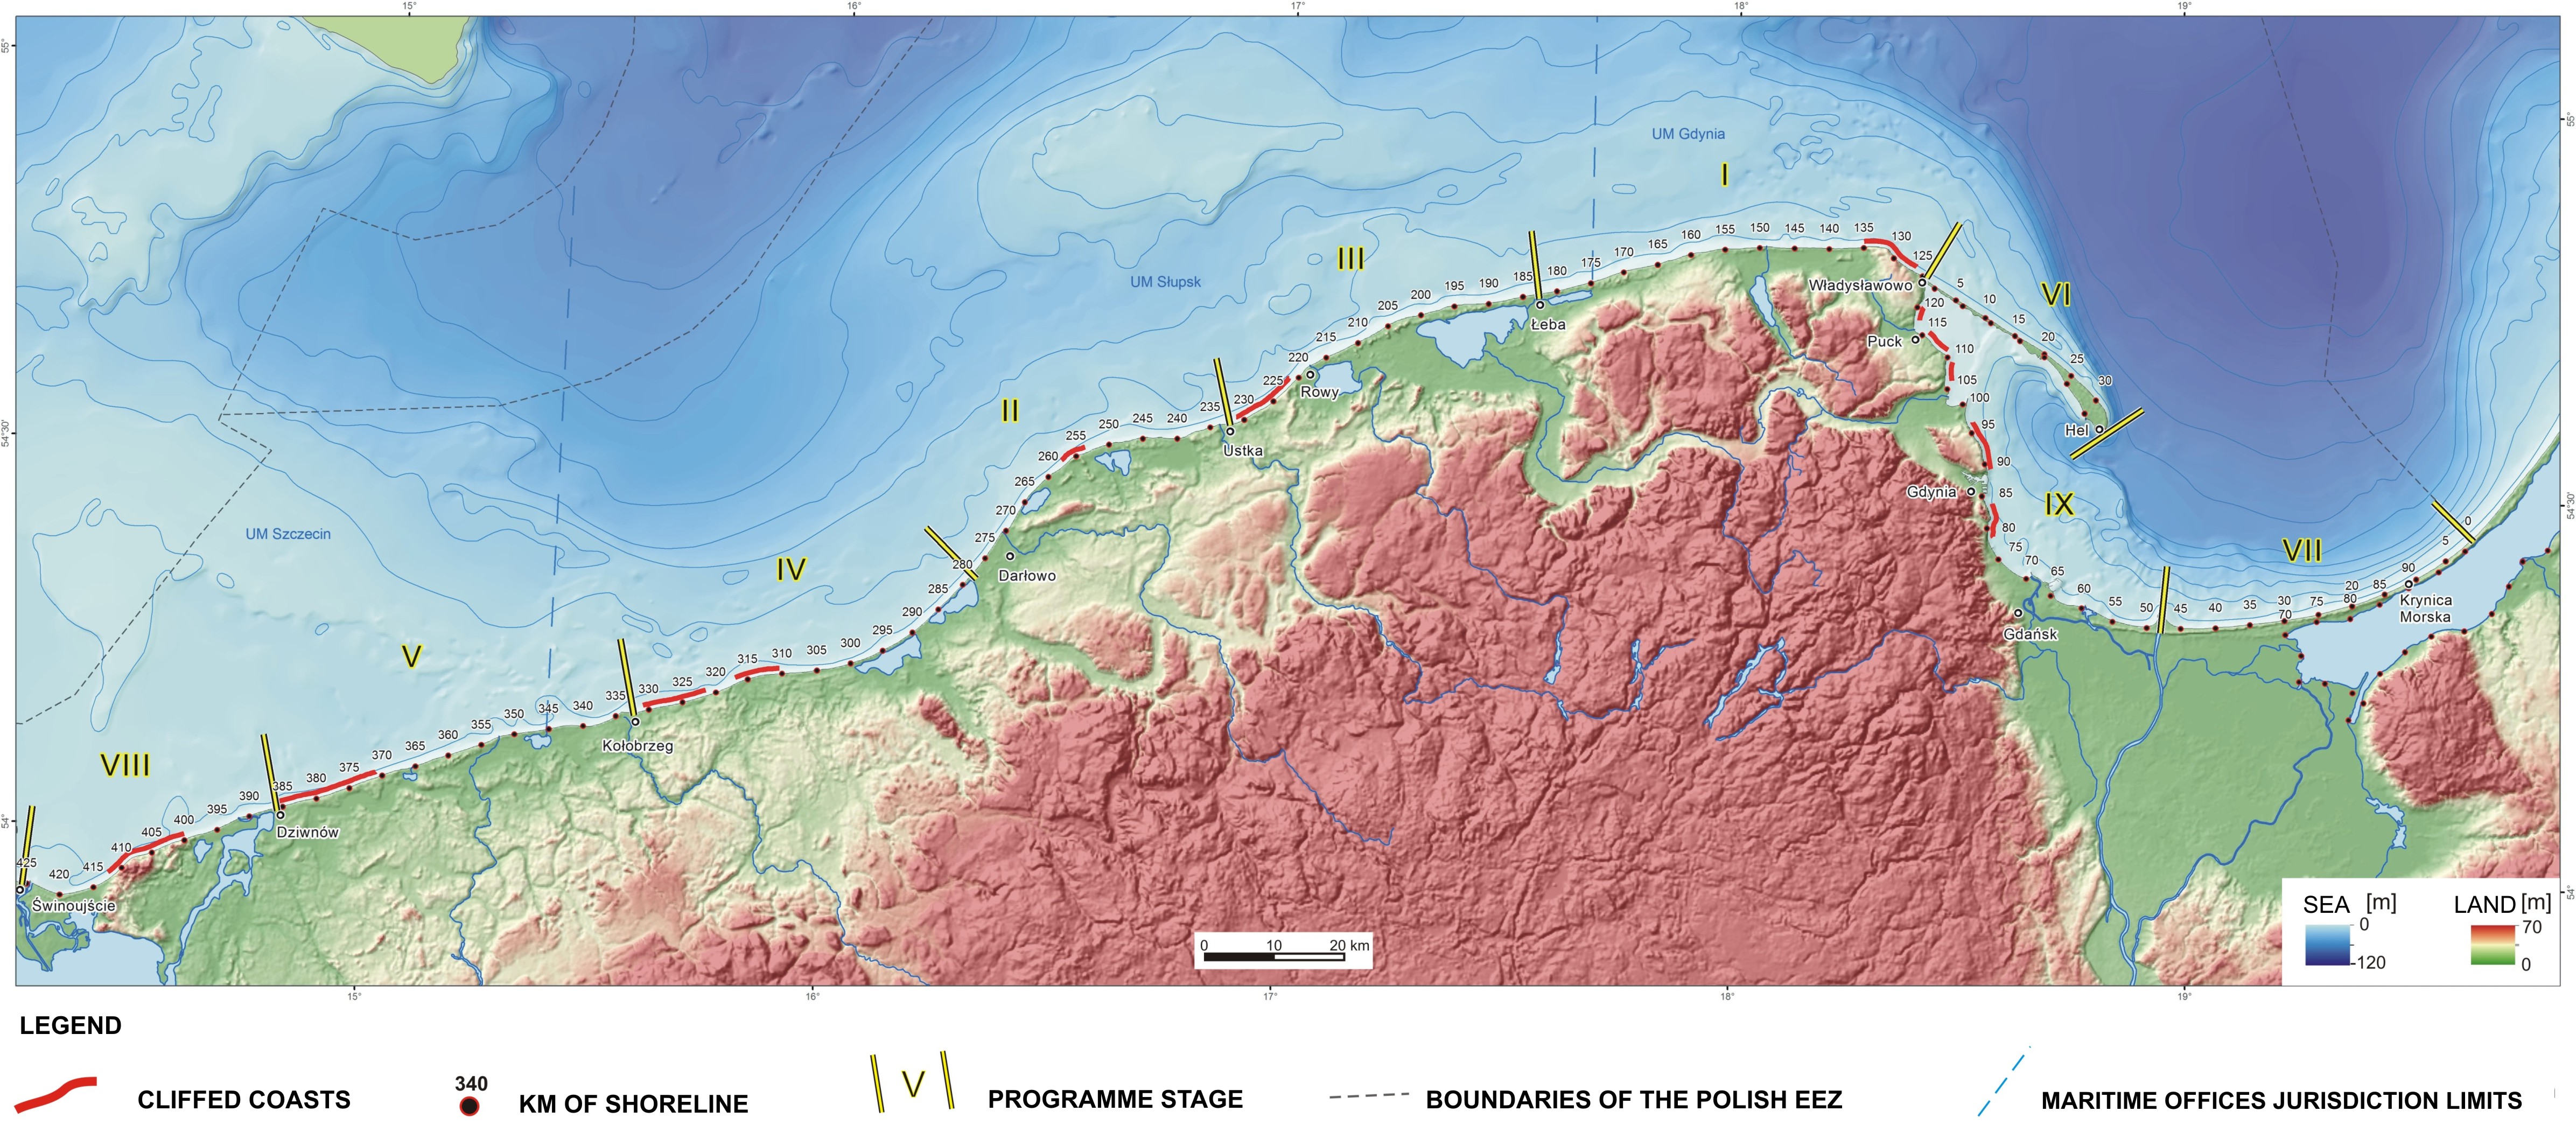
Fig. 8. Stages of the 4D Mapping Programme shown on the digital elevation model of the Polish coast
Selected literature:
- FRYDEL, J., MIL, L., SZARAFIN, T., KOSZKA-MAROŃ, D., PRZYŁUCKA, M. (2017) Spatiotemporal differentiation of cliff erosion rate within the Ustka Bay near Orzechowo (in Polish with English abstract), Landform Analysis, 34, pp. 3–14. doi: 10.12657/landfana-034-001
- MAŁKA, A., FRYDEL, J. and JURYS, L. (2017) Causes of natural and anthropogenic mass movements in Gdynia (in Polish with English abstract), Biuletyn Państwowego Instytutu Geologicznego, (0), pp. 63–80. doi: 10.5604/01.3001.0010.6924.
Text and photos: Jerzy Frydel
Translated by Tomasz Żuk
 PGI-NRI offer
 Mineral resources of Poland
  Oil and Gas in Poland


 Subscribe to RSS Feed