


 Coastal zones of the seas and oceans pose a major challenge to Quaternary researchers because of their particular vulnerability to change. In a world shaped by extreme phenomena, the course of these changes may have a significant impact on population and infrastructure.
During the last 24 thousand years, the area of Poland was subjected to a series of geological processes that shaped the landscape to its present form.
In the late Pleistocene, during the late phase of glaciation, the ice sheet gradually disappeared and waters flowing from its melting front filled the basin in its foreland forming the Baltic Ice Lake. The lake was an early stage in the development of today's Baltic Sea. As a result of isostatic movements in the Holocene (uplift of the Earth's crust after retreat of the glacier) and eustatic movements (as a result of climatic changes) both the level and latitudinal extent of the Baltic Sea at that time underwent changes: regression - retreat towards the North and transgression - increase of the latitudinal extent towards the South.
Reconstruction of the palaeodynamics of glacier recession and subsequent development of the Baltic Sea shoreline was possible thanks to application of a numerical model developed at the Marine Geology Branch of the Polish Geological Institute (PGI-NRI) and published as "Numerical model of late Pleistocene and Holocene ice-sheet and shoreline dynamics in the southern Baltic Sea, Poland " in the interdisciplinary journal of Quaternary Research (© University of Washington. Published by Cambridge University Press, 2022). The model is characterised by high accuracy and precision of mapping, resulting in cloud-based simulations running in a coherent spatial and temporal environment combining past, present and future.
A commonly used method for identifying the dynamics of shoreline changes is to define a certain number of profiles perpendicular to the shore (transects), while the postulated approach is based on real-time controlled explorations along the shore, conducted in the open graphical environment of Desmos. The principle of the model involves the use of functional programming, which assigns mathematical functions to the different extents of ice sheet and sea development phases, and then determines the area between two successive stages of development through integral calculus. After substituting the results into formulas, palaeogeographic relationships are immediately transformed into dynamics as a function of time, shown in the autoregressive nested matrix of the 4F model (Fig. 1).
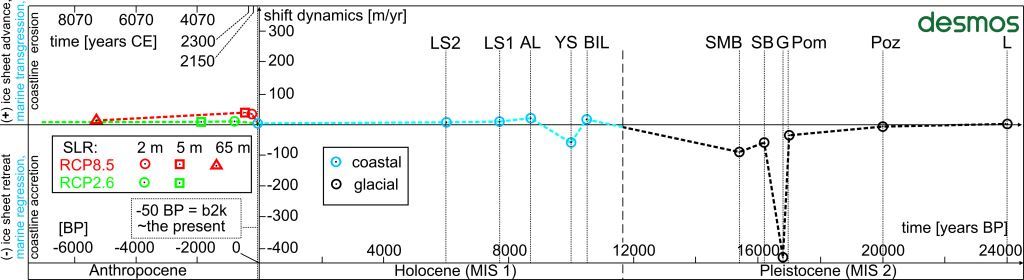
Fig.1 Nested model of shift dynamics in the time function (dashed line) of the Scandinavian ice-sheet recession in the late Pleistocene (Marine Oxygen Isotope Stage 2 [MIS 2]) based on Marks (2002) and Marks et al. (2016) (black); the development dynamics of the southern Baltic Sea (SBS) in the Holocene (MIS 1) (blue) (Uścinowicz, 1995, 1999); and dynamics forecasts of erosion in the Anthropocene, in the light of projected gmsl-rise RCP8.5 and RCP2.6 scenarios: red, Oppenheimer et al. (2019), and green, Golledge (2020), modified from the 4F model nested matrix. Glacial phases: L, Leszno (B, Brandenburg Phase); Poz, Poznań (F, Frankfurt Phase); Pom, Pomeranian; G, Gardno; SB, Słupsk Bank; SMB, Southern Middle Bank. SBS development phases (Uścinowicz, 1995, 1999): BIL, Baltic Ice Lake; YS, Yoldia Sea; AL, Ancylus Lake; LS1, early Littorina Sea; LS2, late Littorina Sea. The Desmos icon contains a hyperlink to the 4F model, last accessed on February 4, 2021
The numerical model provided insight into dynamics of well-documented past geological processes, including deglaciation dynamics, in the light of palaeoclimatic reconstructions in the Tatra Mts. in Pleistocene (Fig.2) and transgression and regression dynamics of the southern Baltic Sea in the light of sea-level change curve in Holocene (Fig.3).
Moreover, the model also allows the simulation of the dynamics of future coastal changes (erosion and accumulation) taking into account a linearly extrapolated spectrum of predicted sea levels determined with the use of representative concentration pathways (RCP) scenarios. The simulations are important in view of the progression of climate warming of recent years, which favours the melting of glaciers and increases the rate of global ocean level rise, thus increasing the threat of erosion to the coasts of the seas and oceans. Therefore, the importance of the presented approach lies in its direct application both for hindcasting of past geologic processes (Figs. 2-3) and for forecasting purposes (Fig.4), including the basis for spatial planning in areas requiring coastal protection.
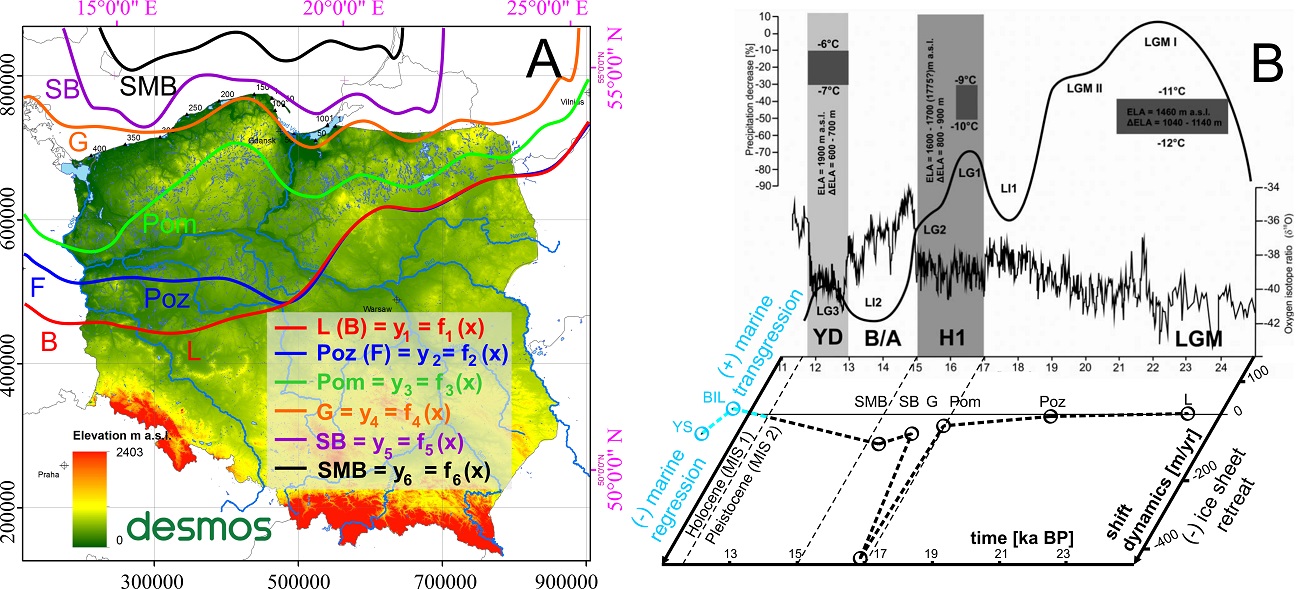
Fig.2. (A) Palaeogeographic reconstruction of the Weichselian glaciation phase ranges; modified from the 4F model. The Desmos icon contains a hyperlink to the 4F model, last accessed on February 4, 2021. (B) Summary of palaeoclimatic reconstructions in the Tatra Mountains originates from Marks (2002) and Marks et al. (2016) and is supplemented with the diagram of deglaciation dynamics in the time function (Fig. 1); dashed line indicates the pace of ice-sheet retreat in m/yr; solid black line shows changes of relative glacial extent during subsequent advances in the study area; LGM, last glacial maximum; LG1–3, late-glacial stadials 1–3; LI1–2, late-glacial interstadials 1 and 2; B/A, Bölling/Allerød interstadial; YD, Younger Dryas; H1, Heinrich event 1; (modified from Marks et al., 2016), coordinate system ETRS 1989 PL-1992 (EPSG 2180). See Fig. 1 for definitions of abbreviations
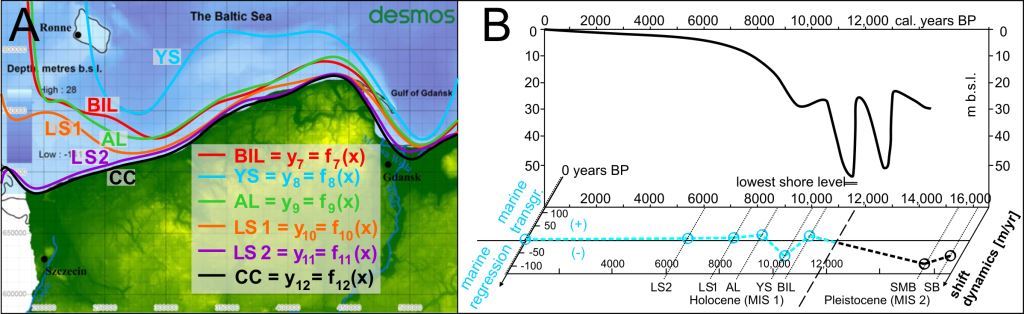
Fig.3 Palaeogeography (A) and palaeodynamics (B) of the SBS) development in the Holocene in the light of the relative sea-level rise (SLR) curve (Uścinowicz, 1995, 1999, 2004, 2014), modified from the 4F model, the Desmos icon contains a hyperlink to the 4F model, last accessed on February 4, 2021. (B) Relative SLR curve for the SBS (Fig. modified from Uścinowicz, 2004, 2014); and supplemented with the SBS developmental dynamics. See Fig. 1 for definitions of abbreviations
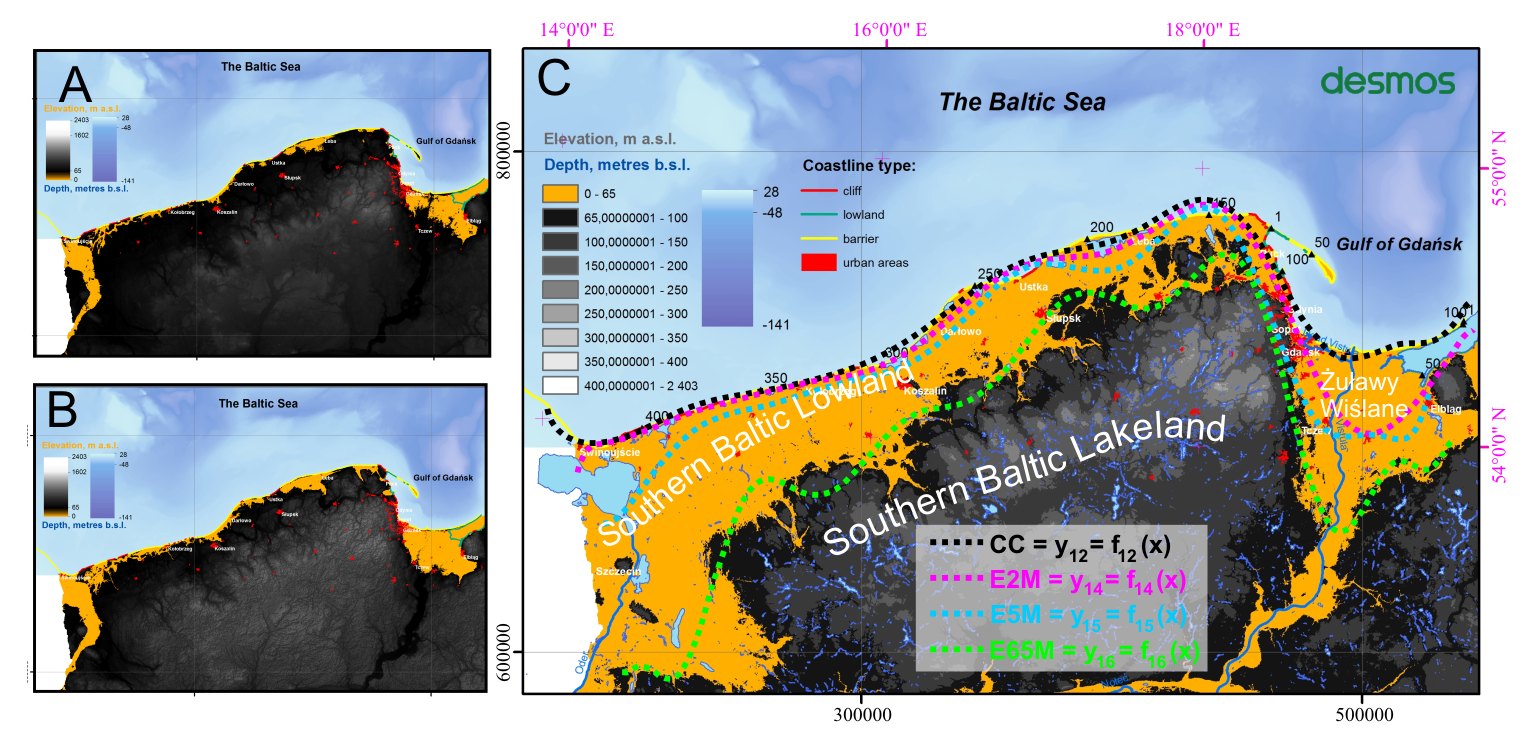
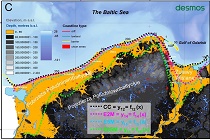
Fig.4 Projection of the SBS extent in the Anthropocene based on gmsl-rise RCP8.5 and RCP2.6 scenarios: (A) sea-level rise (SLR) by 2 m by 2190–2720 CE; (B) SLR by 5 m by 2400–3800 CE; (C) SLR by 65m (ice sheet–free Earth); consecutive functions marked with dotted lines correspond to each scenario: (A) purple; (B) blue; (C) green; dotted black line represents the current coastline, modified from the 4F model, coordinate system ETRS 1989 PL-1992 (EPSG 2180). The Desmos icon contains a hyperlink to the 4F model, last accessed on February 4, 2021.
The applied model is scalable and its working principle is universal, so after modifications it may be applied in any geographical region, allowing both reconstructions and forecasts, also in a wider time frame and a larger (or smaller) spatial range. Among the challenges for the future is to link the influence of hydrometeorological conditions, geological structure and coastal engineering on the development of mass movements (especially landslides), with the variability of coastal dynamics at local (Frydel, J.J., unpublished data) and regional scales. Nevertheless, some issues related to sustainable coastal zone management are still disputed, including the adoption of strategies that balance safety, economic prospects and an approach that favours the preservation of natural landscape values, with as little human interference as possible.
Literature:
- Frydel, J.J., 2022, Numerical model of late Pleistocene and Holocene ice-sheet and shoreline dynamics in the southern Baltic Sea, Poland. Quaternary Research, p. 1–14, https://www.doi.org/10.1017/qua.2021.64
- Frydel, J.J., Mil, L., Szarafin, T. Koszka-Maroń, D., Przyłucka, M., 2017. Spatiotemporal differentiation of cliff erosion rate within the Ustka Bay near Orzechowo. [In Polish, with English abstract]. Landform Analysis 34, 3–14. https://www.doi.org/10.12657/landfana-034-001
- www.desmos.com/calculator/ykqpxwwnup?lang=en – schematic basic model
- www.desmos.com/calculator/cxrue8fwkh?lang=en – simulation of the dynamics of Quaternary geological processes
 PGI-NRI offer
 Mineral resources of Poland
  Oil and Gas in Poland


 Subscribe to RSS Feed