


2025
General information and occurrence
According to the industry standard no. PN-EN 13043:2004 there are major groups of mineral aggregates differentiated: natural aggregates, artificial aggregates and aggregates coming from recycling. Natural sandy-gravelly aggregates and natural crushed aggregates are classified into the first group above mentioned.Natural sandy-gravelly aggregates are divided into two main groups: coarse aggregates, comprising gravel and sandy-gravelly aggregates, and that of fine aggregates – sandy. Sands in Poland are usually evenly arranged and only southern Voivodships are characterized by their shortage. In turn, coarse aggregates – particularly demanded – occur unevenly and especially central Voivodships are characterized by deficiency.
The majority of Polish natural sand and gravel deposits is of the Quaternary age. The share of deposits of older formations: the Pliocene, Miocene and Liassic in the age is subordinate.
A quality of the raw material, and especially deposits homogeneity, depends mainly on a genetic type of a given deposit. Among the Quaternary deposits, there are three genetic types differentiated: glacial, fluvioglacial and fluvial (river). They are characterized by a zonality of occurrence.
In the southern part of Poland, in the Carpathian-Sudetic zone, the most important are deposits of the fluvial (river) origin. In the Sudety Mts., deposits of sandy-gravelly higher terraces of the Pleistocene age prevail, built mainly of the crystalline rocks and sandstone. In turn, in the Carpathian region the main raw material basis comprises gravelly and sandy-gravelly deposits occurring on flood-plain terraces as well as valley side terraces rising above flood plains. The Carpathian deposits are characterized by a predominance of material coming from a disintegration of flysch rocks, except for those of the Dunajec River valley, showing a fairly high contribution of crystalline rocks from the Tatry Mts.
In northern and central Poland – on the Polish Lowlands, the most important are deposits of the glacial (an accumulation platform of front moraine), fluvioglacial (outwashes, eskers) and fluvial (river) origin. Deposits from the northern part of that area are represented by gravelly-sandy accumulations mainly comprising the Scandinavian material – debris of crystalline rocks and limestone with an admixture of quartz and sandstone. In the central and southern parts of this region, deposits are mainly formed of sandy sediments with a significant contribution of a debris of local rocks.
Deposits of high-quality natural sandy-gravelly aggregates are also located on the Polish maritime area (Baltic Sea). They are of fluvioglacial processes and selection of maritime sediments origin. They are characterized by an isolated form of deposit fields with irregular shape and varying thickness.
According to the Regulation of the Minister of the Environment of the 1st of July 2015 regarding the geological documentation of a mineral deposit, excluding a hydrocarbons field (Journal of Laws 2015, Item 987), establishing e.g. limit values of parameters that define a deposit and its boundaries, a feldspar-quartzitic sand deposit with a sand content above 75% should be characterized by a thickness not smaller than 2 m with a ratio of overburden to deposit thickness not higher than 0.3 and a content of mineral silts fraction below 10%; whereas a gravelly, gravelly-sandy and sandy-gravelly deposit with a sand content below 75% should be characterized by a thickness not smaller than 2 m with a ratio of overburden to deposit thickness not higher than 1.0 and a content of mineral silts fraction below 15%.
Sand and gravel deposits occurrence in Poland is presented on the map.
Resources and output
Table 1 shows resources and current state of exploration and development of natural sand and gravel aggregates.
Anticipated economic resources of natural aggregates as of 31.12.2025 totaled 21,795.91 million tonnes. The resources increased by 433.51 million tonnes, that is by 2.03% in relation to the previous year. The growth dynamism increased in comparison with the previous year when it was equal 1.09%.
Natural sandy-gravelly aggregates have been documented within four subtypes: sands; sand with gravel; gravel; loamy and silty sands. Resources of sand deposits with a sand content above 75% amount to 10,992.76 million tonnes (increased by 348.29 million tonnes in comparison with 2024) from which 2,936.06 million tonnes are within exploited deposits. Resources of gravelly-sandy and sandy-gravelly aggregates with a sand content between 30 and 75% amount to 9,715.48 million tonnes (growth by 33.71 million tonnes). Resources of gravel (with a sand content 30%) amount to 1,050.10 million tonnes (growth by 52.02 million tonnes) and resources of silty, loamy sands amount to 37.57 million tonnes.
The resources increased due to:
- Including into domestic registry 354 new deposits with the total resources equal nearly 654 million tonnes. In 2025, the largest resource volumes were documented in Pomorskie Voivodship (136.71 million tonnes in 32 deposits). The largest were the following deposits: Gliśno VII (38.8 million tonnes), Częstkowo II (17.67 million tonnes), Strzelęcino III-1 (15.36 million tonnes). In 16 other deposits, there were from 1.3 million tonnes to 8.8 million tonnes of resources documented. In the second best, regarding new resources, Warmińsko-Mazurskie Voivodship, there were 75 million tonnes of resources documented (34 new deposits). Among them, the largest deposits are as follows: Botowo-Labuszewo (28.73 million tonnes), Konopki I (8.74 million tonnes), Bramka III (7.33 million tonnes), Czaple-Krokocie (6.55 million tonnes), Grabówka (5.6 million tonnes). In 9 other deposits, there were from 0.9 million tonnes to 2.4 million tonnes of resources documented. The next but three, regarding new resources volumes, is Małopolskie Voivodship – nearly 75 million tonnes of resources in 13 deposits. The largest among them are: Rusocice (27.81 million tonnes), Drwinia-Grobla (12.47 million tonnes), Smolice-Lipowa (8.26 million tonnes). Except for above mentioned deposits, the largest resources volumes were documented in the following deposits: Smolarzyny (10.61 million tonnes) in Podkarpackie Voivodship, Osuchów (25.78 million tonnes) in Mazowieckie Voivodship, Sępólno Wielkie 7 (16.9 million tonnes) in Zachodniopomorskie Voivodship, Jastrowie XII (11.53 million tonnes) in Wielkopolskie Voivodship, Kaniów VI (10.98 million tonnes) in Śląskie Voivodship, Bucze I (11.38 million tonnes) in Lubuskie Voivodship. The smallest resources volume, regarding Voivodships, that is 1.9 million tonnes, was documented in Opolskie Voivodship (4 deposits). Resources of new deposits, approved by the Marshalls of Voivodships, amounted to 611 million tonnes (in 184 deposits), whereas resources of new deposits, approved by the county mayors, amounted to 43 million tonnes (in 170 deposits).
- Verification and updating of resources due to deposit area enlargement or deepening of its range, resources updating as a result of a longtime exploitation, change of a deposit usage and its designation in site management plans within the borders of which a deposit was documented, or resources settlement after allocation of new deposits documented within the area of previously explored. The most significant resources growths coming from supplements to geological documentation were recorded in the following deposits: Solarnia (42.89 million tonnes) in Opolskie Voivodship, Gliśno 3 (25.12 million tonnes) in Pomorskie Voivodship, Bór – Zagórze (16.52 million tonnes) in Małopolskie Voivodship, Wierzchowo I (15.21 million tonnes) in Zachodniopomorskie Voivodship, Proszkowice (11.05 million tonnes) in Dolnośląskie Voivodship. In 22 other deposits, resourtabces increased from about 1 million tonnes to above 3 million tonnes (above 37 million tonnes in total), whereas in 48 deposits resources growth was between 0.1 million tonnes and 1 million tonnes (above 16 million tonnes in total).
- Balance of resources drops and growths, established in supplements to geological documentations or being the results of current resources verification connected with exploitation – 44 million tonnes.
The resources decreased by:
- Output (171.24 million tonnes).
- Crossing 189 aggregate deposits out from domestic registry – about 93 million tonnes in total. The largest resources volumes were crossed out from the e.g. deposits: Jabłonka (-35.07 million tonnes) in Małopolskie Voivodship, Nowe Żabno – Południe (-5.1 million tonnes) and Bucze-Południe (-2.32 million tonnes) in Lubuskie Voivodship, Osowa II (-4.17 million tonnes), Bohoniki (-2.26 million tonnes) and Biała Woda VI (-2.83 million tonnes) in Podlaskie Voivodship, Gołaszyn I (-2.47 million tonnes) in Lubelskie Voivodship. In 24 other deposits, there were above 20 million tonnes of anticipated economic resources crossed out from domestic registry. In 70 deposits crossed out from domestic registry, where resources were equal between 0.1 million tonnes and 1 million tonnes, the total drop was about 16 million tonnes. In 35 deposits crossed out from domestic registry, resources were equal a dozen or so thousand tonnes or there were no documented resources at all. The largest resources volumes were crossed out in the following Voivodships: Małopolskie (-35.3 million tonnes) and Podlaskie (-17.3 million tonnes).
- Resources reduction by approval of supplements to geological documentations for e.g. deposits: Kozin (-20.55 million tonnes), Strzelęcino III (-13.42 million tonnes) and Żelazno (-8.81 million tonnes) in Pomorskie Voivodship, Wola Radłowska Grądy I (-5.58 million tonnes), Węgrzce Wielkie (-7.43 million tonnes) and Czchów II (-4.97 million tonnes) in Małopolskie Voivodship, Kamionka-Drahle 1 (-7.55 million tonnes) in Podlaskie Voivodship. In 13 other deposits, resources drops were equal from about 0.1 million tonnes to 0.9 million tonnes – about 24 million tonnes in total.
Total anticipated economic resources increased in Poland, similarly to the previous years, and it was a result of increases of documented resources in most of Voivodships. The most significant growths were recorded in e.g. Voivodships: Pomorskie, Warmińsko-Mazurskie, Zachodniopomorskie and Podkarpackie. Domestic economic resources increased by 108 million tonnes in total. Growths of these resources were recorded in 9 Voivodships, whereas decreases in the remaining ones and on the Baltic Sea. The most significant economic resources growths were recorded in: Pomorskie, Podkarpackie and Łódzkie Voivodships. Tables below show changes within anticipated economic resources and economic resources in particular Voivodships in 2025:
Changes in anticipated economic resources
|
Increases (thousand tonnes)
|
Decreases (thousand tonnes)
|
||
| Pomorskie Voivodship | 102,876 | Podlaskie Voivodship | -24,632 |
| Warmińsko-Mazurskie Voivodship | 59,285 | Baltic Sea | -2,693 |
| Zachodniopomorskie Voivodship | 56,062 | Lubuskie Voivodship | -358 |
| Podkarpackie Voivodship | 51,376 | ||
| Mazowieckie Voivodship | 42,690 | ||
| Opolskie Voivodship | 36,045 | ||
| Wielkopolskie Voivodship | 31,943 | ||
| Kujawsko-Pomorskie Voivodship | 26,544 | ||
| Małopolskie Voivodship | 18,970 | ||
| Lubelskie Voivodship | 11,415 | ||
| Śląskie Voivodship | 7,384 | ||
| Dolnośląskie Voivodship | 6,228 | ||
| Świętokrzyskie Voivodship | 5,436 | ||
| Łódzkie Voivodship | 4,940 | ||
| Increases in total | 461,195 | Decreases in total | -27,683 |
Changes in economic resources
|
Increases (thousand tonnes)
|
Decreases (thousand tonnes)
|
||
| Pomorskie Voivodship | 47,794 | Śląskie Voivodship | -6,852 |
| Podkarpackie Voivodship | 15,256 | Warmińsko-Mazurskie Voivodship | -6,618 |
| Łódzkie Voivodship | 14,486 | Podlaskie Voivodship | -5,470 |
| Zachodniopomorskie Voivodship | 13,451 | Małopolskie Voivodship | -2,842 |
| Opolskie Voivodship | 11,567 | Baltic Sea | -2,693 |
| Lubuskie Voivodship | 11,348 | Lubelskie Voivodship | -2,292 |
| Mazowieckie Voivodship | 10,166 | Świętokrzyskie Voivodship | -2,042 |
| Wielkopolskie Voivodship | 8,032 | Dolnośląskie Voivodship | -1,222 |
| Kujawsko-Pomorskie Voivodship | 5,681 | ||
| Increases in total | 137,782 | Decreases in total | -30,030 |
In deposits which were included into a current edition of “The balance…”, there was mainly sand documented in a volume exceeding 425 million tonnes – from which the biggest deposits are: Gliśno VII (28.32 million tonnes) and Strzelęcino III-1 (15.36 million tonnes) in Pomorskie Voivodship, Osuchów (25.78 million tonnes) in Mazowieckie Voivodship. Resources of sand and gravel in new deposits are equal above 213 million tonnes, in e.g. deposits: Botowo-Labuszewo (28.73 million tonnes) in Warmińsko-Mazurskie Voivodship and Rusocice (27.81 million tonnes) in Małopolskie Voivodship. Resources of gravel in new deposits are equal nearly 16 million tonnes (in 4 deposits) and the largest deposits are: Kaniów VI (10.98 million tonnes) in Śląskie Voivodship and Palczowice-Smolice (4.65 million tonnes) in Małopolskie Voivodship. Distribution of resources of particular subtypes in new deposits – regarding particular Voivodships in alphabetical order – is presented below:
|
Voivodship/Region
|
Sand (million tonnes) |
Sand with gravel (million tonnes) |
Gravel (million tonnes) |
| Baltic Sea | - | - | - |
| Dolnośląskie | 3.9 | 2.4 | - |
| Kujawsko-Pomorskie | 27.9 | 3.8 | - |
| Lubelskie | 23.4 | 0.3 | - |
| Lubuskie | 11.6 | - | - |
| Łódzkie | 14.0 | 2.3 | - |
| Małopolskie | 8.0 | 61.9 | 4.8 |
| Mazowieckie | 50.7 | 6.5 | - |
| Opolskie | 0.7 | 1.2 | - |
| Podkarpackie | 49.4 | 12.6 | 0.3 |
| Podlaskie | 11.7 | 20.3 | - |
| Pomorskie | 111.2 | 25.5 | - |
| Śląskie | 4.7 | - | 11.0 |
| Świętokrzyskie | 7.2 | - | - |
| Warmińsko-Mazurskie | 4.6 | 70.4 | - |
| Wielkopolskie | 46.5 | 0.4 | - |
| Zachodniopomorskie | 49.3 | 5.5 | - |
Total area of deposits included into domestic registry in 2025 amounted to 3,076 ha. The largest from these deposits are: Rusocice (178 ha) and Drwinia-Grobla (110 ha) in Małopolskie Voivodship, Gliśno VII (88 ha) in Pomorskie Voivodship, Sępólno Wielkie 7 (78 ha) in Zachodniopomorskie Voivodship. Total area of deposits crossed out from domestic registry in 2025 is equal about 794 ha.
The biggest numbers of deposits are currently documented in the following Voivodships (in descending sequence): Mazowieckie (1,552), Wielkopolskie (1,368), Lubelskie (1,035), Warmińsko-Mazurskie (913), Podlaskie (886) and Łódzkie (872).
Voivodships with the largest documented resources volumes are (in descending sequence): Dolnośląskie (2,347 million tonnes), Małopolskie (1,881 million tonnes), Podlaskie (1,799 million tonnes), Opolskie (1,547 million tonnes), Mazowieckie (1,527 million tonnes) and Zachodniopomorskie (1,516 million tonnes).
Resources of deposits covered by detailed exploration (A, B and C1 categories) are equal 14,387.28 million tonnes and account for 66.1% of the total resources. Resources covered by preliminary exploration (C2 and D categories) account for 34% of the total resources and amount to 7,408.63 million tonnes. Resources of exploited deposits, being equal 6,331.90 million tonnes (growth by 56.5 million tonnes in comparison with 2024), account for 29% of the total resources. Non-exploited deposits contain 13,149.99 million tonnes (60.3%) of resources (growth by 310.71 million tonnes), whereas resources of abandoned deposits are equal 2,314.02 million tonnes – growth by 66.35 million tonnes.
Economic resources amounted in 2025 to 4,508.27 million tonnes. Economic resources, established for exploited deposits, are equal 3,739.17 million tonnes, whereas anticipated economic resources within exploited deposits are equal 6,331.90 million tonnes. Distribution of resources (anticipated economic, economic and anticipated economic of exploited deposits) within exploited deposits in particular Voivodships as of the end of 2025 was as follows:
|
Voivodship/ Region
|
Resources of exploited deposits (million tonnes)
|
||
| Anticipated economic | Economic | Anticipated economic of exploited deposits |
|
| Poland | 6,331.90 | 3,739.17 | 4,763.03 |
| Baltic Sea | 80.23 | 79.28 | 42.49 |
| Dolnośląskie | 654.12 | 301.79 | 559.09 |
| Kujawsko-Pomorskie | 161.98 | 108.99 | 120.80 |
| Lubelskie | 163.96 | 88.52 | 124.38 |
| Lubuskie | 300.96 | 176.25 | 159.96 |
| Łódzkie | 338.49 | 205.97 | 271.01 |
| Małopolskie | 388.58 | 112.04 | 323.18 |
| Mazowieckie | 451.41 | 300.30 | 302.88 |
| Opolskie | 314.40 | 143.38 | 297.38 |
| Podkarpackie | 261.26 | 113.47 | 214.54 |
| Podlaskie | 885.16 | 558.16 | 603.17 |
| Pomorskie | 520.04 | 384.24 | 413.36 |
| Śląskie | 227.82 | 81.55 | 185.39 |
| Świętokrzyskie | 89.95 | 48.16 | 85.65 |
| Warmińsko-Mazurskie | 397.75 | 331.74 | 244.94 |
| Wielkopolskie | 498.84 | 305.32 | 368.25 |
| Zachodniopomorskie | 596.98 | 400.04 | 446.57 |
In 2025, output of sand and gravel amounted to 171.2 million tonnes. In comparison with the previous year, exploitation decreased by -8.87 million tonnes, that is by 4.9%. The output dropped in 12 Voivodships, whereas grew in the following Voivodships: Śląskie, Dolnośląskie, Świętokrzyskie and Małopolskie; there was also growth recorded on the Baltic Sea. In particular Voivodships the output balance in 2025 is as follows:
|
Output
in comparison with 2024 |
The difference (thousand tonnes) |
The difference (%) |
| Total | -8,856.41 | -4.9 |
| Baltic Sea | 2,267.49 | 327.9 |
| Śląskie Voivodship | 527.60 | 9.7 |
| Dolnośląskie Voivodship | 597.43 | 5.3 |
| Świętokrzyskie Voivodship | 95.34 | 4.7 |
| Małopolskie Voivodship | 387.04 | 3.4 |
| Opolskie Voivodship | -215.50 | -2.9 |
| Warmińsko-Mazurskie Voivodship | -619.59 | -4.3 |
| Pomorskie Voivodship | -948.53 | -4.5 |
| Podlaskie Voivodship | -1,811.00 | -5.3 |
| Wielkopolskie Voivodship | -983.88 | -8.9 |
| Kujawsko-Pomorskie Voivodship | -454.02 | -9.7 |
| Podkarpackie Voivodship | -954.01 | -10.4 |
| Łódzkie Voivodship | -1,169.97 | -13.0 |
| Mazowieckie Voivodship | -1,600.02 | -13.3 |
| Lubuskie Voivodship | -813.29 | -14.8 |
| Zachodniopomorskie Voivodship | -1,956.25 | -14.9 |
| Lubelskie Voivodship | -1,205.25 | -15.5 |
A number of sand and gravel deposit in 2025 amounted to 11,376, including 2,458 of exploited deposits (in this group there are deposits crossed out from current registry and those for which concessions were abolished and the deposits were marked as abandoned). In comparison with the previous year (2,448 deposits), the number increased. A number of non-exploited deposits increased by 148 (from 8,768 in 2024 to 8,918 in 2025); Table 2).
Natural sand and gravel are also obtained during exploitation of brown coal deposits. In 2025, the output of the raw material from non-documented deposits, during exploitation in the Bełchatów mine from the Szczerców field, amounted to 507.44 thousand tonnes, whereas in the Turów mine it was 10.26 thousand tonnes of natural aggregates: sandy, sandy-gravelly and gravelly-sandy.
Figure below shows changes in domestic resources and production of sand and gravel in Poland in the years 1989-2025.
Prognostic resources of natural sandy-gravelly aggregates are assessed to be equal more than 13 billion tonnes*. They occur quite evenly in Poland – in all Voivodships and on the Polish maritime area.
Prepared by: Wojciech Miśkiewicz, Dariusz Brzeziński, Anna Kalinowska, Joanna Stawierej, Wojciech Szczygielski
* Kozłowska O., Smakowski T., Miśkiewicz W., 2020 – ‘Kruszywo naturalne piaskowo-żwirowe (natural aggregates)’. In: ‘Bilans perspektywicznych zasobów kopalin Polski wg stanu na 31.12.2018 r.’ (eds. Szamałek K., Szuflicki M., Mizerski W.): 258-275. PIG-PIB, Warszawa [in Polish].
2024
General information and occurrence
According to an industry standard no PN-EN 13043:2004 there are major groups of natural sandy-gravelly aggregates differentiated: natural aggregates, artificial aggregates and aggregates coming from recycling. Natural sandy-gravelly aggregates and natural crushed aggregates are classified into the first group above mentioned. Natural sandy-gravelly aggregates are divided into 2 main groups: coarse aggregates, comprising gravel and sandy-gravelly aggregates, and that of fine aggregates – sandy. Sands in Poland are usually evenly arranged and only southern Voivodeships are characterized by their shortage. In turn, course aggregates – particularly demanded – occur unevenly and especially central Voivodeships are characterized by the deficiency.
The bulk of Polish natural sand and gravel deposits are of the Quaternary age. The share of deposits of older formations: the Pliocene, Miocene and Liassic in the age is subordinate.
The quality of the raw material, and especially deposits homogeneity, depends largely on a genetic type of a given deposit. Among the Quaternary deposits, there are 3 genetic types differentiated: glacial, fluvioglacial and fluvial (river). They are characterized by a zonality of the occurrence.
In the southern part of Poland, in the Carpathian-Sudetic zone, the most important are deposits of the fluvial (river) origin. In the Sudety Mts., the deposits of sandy-gravelly higher terraces of the Pleistocene age prevail, built mainly of the crystalline rocks and sandstones. In turn, in the Carpathian region the main raw material basis comprises gravelly and sandy-gravelly deposits occurring on flood-plain terraces as well as valley side terraces rising above flood plains. The Carpathian deposits are characterized by a predominance of the material coming from a disintegration of flysch rocks, except for those of the Dunajec River valley, showing a fairly high contribution of the crystalline rocks from the Tatry Mts.
In northern and central Poland – on the Polish Lowlands, the most important are deposits of a glacial (an accumulation platform of front moraine), fluvioglacial (sandrs, eskers) and fluvial (river) origin. Deposits from the northern part of that area are represented by gravelly-sandy accumulations mainly comprising the Scandinavian material – debris of crystalline rocks and limestones with an admixture of quartz and sandstones. In the central and southern parts of this region, the deposits are mainly formed of sandy sediments with a significant contribution of a debris of local rocks.
The deposits of a high quality natural sandy-gravelly aggregates are also located on the Polish maritime area (Baltic Sea). They are of the fluvioglacial processes and the selection of the maritime sediments origin. They are characterized by the isolated form of deposits fields with irregular shape and varying thickness.
According to the Regulation of the Minister of the Environment of the 1st of July 2015 regarding the geological documentation of a raw material deposit, excluding a hydrocarbons field (Journal of Laws 2015, Item 987), establishing i.a. the limit values of the parameters that define the deposit and its boundaries, a feldspar-quartzitic sand deposit with the sand content above 75% should be characterized by the thickness not smaller than 2 m with the ratio of overburden to deposit thickness not higher than 0.3 and the content of mineral silts fraction below 10%; whereas a gravelly, gravelly-sandy and sandy-gravelly deposit with the sand content below 75% should be characterized by the thickness not smaller than 2 m with the ratio of overburden to deposit thickness not higher than 1.0 and the content of mineral silts fraction below 15%.
The sand and gravel deposits occurrence in Poland is presented on the map.
Resources and output
Table 1 shows resources and the current state of exploration and development of natural sand and gravel aggregates.
Anticipated economic resources of natural aggregates as of 31.12.2024 totaled 21,362.40 million tonnes. The resources increased by 230.6 million tonnes (that is by 1.09%) in relation to the previous year. The growth dynamism decreased in comparison with the previous year when it was equal 2.26%.
The natural sandy-gravelly aggregates have been documented within 4 subtypes: sands, sand with gravel, gravel, loamy and silty sands. Resources of sands with the sand content above 75% amount to 10,644.47 million tonnes (increased by 239.75 million tonnes in comparison with 2023) from which 2,836.49 million tonnes are within exploited deposits. Resources of gravelly-sandy and sandy-gravelly aggregates with the sand content between 30% and 75% amount to 9,681.77 million tonnes (drop by -31.52 million tonnes). Resources of gravel (with the sand content 30%) amount to 998.08 million tonnes (growth by 22.38 million tonnes) and resources of silty, loamy sands amounted to 38.08 million tonnes.
The resources increased due to:
- Including into the registry 291 new deposits with total resources equal above 470 million tonnes. In 2024, the largest resources were documented in Pomorskie Voivodeship (59.69 million tonnes within 24 deposits). The largest deposit is Kozin IV (36.11 million tonnes). In the following deposits: Otomino MW, Trzebielsk Wschód 2, Kistowo, Morany KP, Mirowo XXII, Gapowo MW, Żuromino XI, Gołębiewko VI, Demlin XII, Gostomie XXII there were from 1 million tonnes to 3.4 million tonnes of resources documented. In the second best, regarding new resources, Śląskie Voivodeship, there were documented 55 million tonnes (6 new deposits). The biggest of these deposits are as follows: Pławniowice (35.06 million tonnes), Markowice (11.87 million tonnes). In the following deposits: Jedlina – 1, Bojszowy III, Babice I, Bojszowy II/2 there were from 1.3 million tonnes to 2.6 million tonnes of resources documented. The next but three, regarding new resources volume, is Wielkopolskie Voivodeship with above 47 million tonnes documented in 39 deposits. The largest deposits are: Siemianice (10.83 million tonnes), Jeżewo Bioraj (5.26 million tonnes) and Czarnotki GK (7.71 million tonnes). In the following deposits: Łucjanowo, Katarzynowo IV, Kwilcz KR, Mądre I, Leżenica JT, Zielonowo MŁ II, Police Mostowe II, Chrząblice IV, Kochowo VII, Dęborzyce II there were from 1 million tonnes to 2.9 million tonnes of resources documented. Except for the above mentioned deposits, the largest documented deposits are: Zatoka Gdańska (29.86 million tonnes) on the Baltic Sea, Bukowiec ZGW (15.41 million tonnes) in Lubuskie Voivodeship, Osówka IX (11.97 million tonnes) in Mazowieckie Voivodeship, Nowa Biała I (11.94 million tonnes) in Małopolskie Voivodeship. The smallest resources volume, i.e. 0.41 million tonnes, was documented in Świętokrzyskie Voivodeship (2 deposits). In other Voivodeships, volumes of newly documented resources are between a dozen or so and nearly 30 million tonnes. Resources of new deposits, approved in 2024 by the Minister of Climate and Environment, amounted to 29.86 million tonnes (1 deposit), approved by the Marshalls of Voivodeships amounted to 408 million tonnes (155 deposits) and approved by the county mayors amounted to 32 million tonnes (146 deposits).
- Verification and updating of resources due to deposit area enlargement or deepening of its range, resources updating as a result of a longtime exploitation, change of a deposit usage and its designation in the site management plans within the borders of which the deposit was documented, or resources settlement after an allocation of new deposits documented within the area of previously explored. The most significant resources growths coming from new geological documentations (supplements) were recorded for the following deposits: Smolice-Zakole B (15.52 million tonnes) and Długopole I (8.42 million tonnes) located in Małopolskie Voivodeship, Kończyce-Kamieniec (4.32 million tonnes) in Śląskie Voivodeship. Within 30 other deposits, the resources increased from about 1 million tonnes to above 3.6 million tonnes each (above 42 million tonnes in total), whereas within 54 deposits within the range of about 0.1-1 million tonnes (above 21 million tonnes in total).
- Balance of resources drops and growths, established in new documentations (supplements) with recalculated resources or being the results of the current resources verification connected with exploitation – 29.6 million tonnes.
The resources decreased by:
- Output (180.10 million tonnes).
- Crossing 194 aggregate deposits out from the domestic registry – about 89 million tonnes in total. The largest resources volumes were crossed out from the i.a. deposits: Dobromierz (-10.63 million tonnes) and Wrzosy I (-6.5 million tonnes) located in Kujawsko-Pomorskie Voivodeship, Bukowiec-Stanisław (-7.97 million tonnes) in Lubuskie Voivodeship, Jurcz ME (-6.9 million tonnes) in Dolnośląskie Voivodeship, Łęgowo VII (-5.9 million tonnes) in Warmińsko-Mazurskie Voivodeship, Biała Woda V (-3 million tonnes) and Popławice (-2.54 million tonnes) in Podlaskie Voivodeship. In 10 other deposits, there were above 14 million tonnes of anticipated economic resources crossed out. In 28 deposits crossed out from the registry, resources were equal a dozen or so thousand tonnes or there were no documented resources at all.
- Resources reduction by new documentations (supplements) with recalculated resources elaborated for i.a. deposits: Cieszów-Turów (-8.88 million tonnes) and Nowogród Bobrzański - Zbiornik (-3.64 million tonnes) in Lubuskie Voivodeship, Lamkowo I (-5.82 million tonnes) and Modliny (-6.57 million tonnes) in Warmińsko-Mazurskie Voivodeship, Zielone Kamedulskie IV (-1.35 million tonnes) in Podlaskie Voivodeship, Borucino (-1.2 million tonnes) in Pomorskie Voivodeship, Dołha 2 (-1.06 million tonnes) in Lubelskie Voivodeship, Studzianna JS (-1.04 million tonnes) in Wielkopolskie Voivodeship. Drops in 48 deposits contained the resources from about 0.1 million tonnes to 0.9 million tonnes.
The anticipated economic resources increased in Poland in general, similarly to the previous years, and it was a result of documented resources increases in most of Voivodeships. The most significant increases were recorded in the following Voivodeships: Śląskie, Pomorskie, Wielkopolskie and Małopolskie. The domestic economic resources increased by 70.6 million tonnes in total. Growths of these resources were recorded in 9 Voivodeship, whereas decreases in the remaining ones and on the Baltic Sea. The most significant economic resources growth were noted in Opolskie, Zachodniopomorskie, Lubuskie and Mazowieckie Voivodeships. The tables below shows changes within anticipated economic resources and economic resources in particular Voivodeships in 2024:
Changes in anticipated economic resources
|
Increases (thousand tonnes)
|
Decreases (thousand tonnes)
|
||
| Śląskie Voivodeship | 51,975 | Podlaskie Voivodeship | -29,603 |
| Pomorskie Voivodeship | 43,715 | Lubuskie Voivodeship | -9,378 |
| Wielkopolskie Voivodeship | 34,875 | Warmińsko-Mazurskie Voivodeship | -6,632 |
| Małopolskie Voivodeship | 31,554 | Świętokrzyskie Voivodeship | -1,946 |
| Baltic Sea | 29,349 | ||
| Lubelskie Voivodeship | 26,241 | ||
| Mazowieckie Voivodeship | 19,287 | ||
| Podkarpackie Voivodeship | 15,472 | ||
| Opolskie Voivodeship | 10,361 | ||
| Kujawsko-Pomorskie Voivodeship | 6,916 | ||
| Dolnośląskie Voivodeship | 4,303 | ||
| Łódzkie Voivodeship | 3,747 | ||
| Zachodniopomorskie Voivodeship | 363 | ||
| Total increases | 278,159 | Total decreases | -47,559 |
Changes in economic resources
|
Increases (thousand tonnes)
|
Decreases (thousand tonnes)
|
||
| Opolskie Voivodeship | 30,274 | Pomorskie Voivodeship | -19,699 |
| Zachodniopomorskie Voivodeship | 28,999 | Warmińsko-Mazurskie Voivodeship | -16,921 |
| Lubuskie Voivodeship | 21,426 | Śląskie Voivodeship | -7,317 |
| Mazowieckie Voivodeship | 19,960 | Podkarpackie Voivodeship | -4,438 |
| Wielkopolskie Voivodeship | 11,772 | Kujawsko-Pomorskie Voivodeship | -4,180 |
| Podlaskie Voivodeship | 10,444 | Małopolskie Voivodeship | -2,888 |
| Lubelskie Voivodeship | 3,000 | Dolnośląskie Voivodeship | -1,136 |
| Świętokrzyskie Voivodeship | 1,448 | Baltic Sea | -510 |
| Łódzkie Voivodeship | 375 | ||
| Total increases | 127,698 | Total decreases | -57,088 |
In the deposits, which were included into the current edition of “The balance…”, there was mainly sand documented in the volume exceeding 349 million tonnes from which the biggest deposits are: Pławniowice (35.06 million tonnes) located in Śląskie Voivodeship, Zatoka Gdańska (29.86 million tonnes) on the Baltic Sea, Kozin IV (25.64 million tonnes) in Pomorskie Voivodeship. Resources of sand and gravel in new deposits are equal above 99 million tonnes in i.a. deposits: Goliszów I, Markowice, Kozin IV with resources volumes from 10 million tonnes to 11 million tonnes each, and in 22 other deposits with resources volumes from 1.1 million tonnes to nearly 8 million tonnes (more than 56 million tonnes in total). Resources of gravel in new deposits are equal nearly 21 million tonnes (9 deposits), and the largest deposits are: Nowa Biała I (11.94 million tonnes) and Frydman V (3.33 million tonnes) in Małopolskie Voivodeship, Kozielno-Północ (5.28 million tonnes) in Opolskie Voivodeship. The Voivodeship distribution of the resources of particular subtypes of new deposits is presented below:
|
Voivodeship/Region
|
Sand (million tonnes) |
Sand with gravel (million tonnes) |
Gravel (million tonnes) |
Silty, loamy sand (million tonnes) |
| Baltic Sea | 29.9 | - | - | - |
| Dolnośląskie | 9.1 | 13.6 | - | - |
| Kujawsko-Pomorskie | 28.7 | 1.2 | - | - |
| Lubelskie | 29.1 | - | - | - |
| Lubuskie | 18.8 | - | - | - |
| Łódzkie | 16.8 | - | - | - |
| Małopolskie | 0.4 | 5.8 | 15.4 | - |
| Mazowieckie | 28.9 | 1.4 | - | - |
| Opolskie | 2.1 | 14.7 | 5.3 | - |
| Podkarpackie | 20.3 | 7.1 | 0.3 | - |
| Podlaskie | 10.2 | 3.7 | - | - |
| Pomorskie | 44.2 | 15.5 | - | - |
| Śląskie | 37.2 | 17.8 | - | - |
| Świętokrzyskie | 0.4 | - | - | - |
| Warmińsko-Mazurskie | 11.9 | 18.4 | - | - |
| Wielkopolskie | 47.2 | - | - | - |
| Zachodniopomorskie | 14.1 | - | - | - |
The total area of the deposits included into the registry in 2024 amounted to about 2,813 ha, including 2,114 ha (155 deposits approved by the Marshalls of Voivodeships), 227 ha (146 deposits approved by the counties mayors) and 472 ha (1 deposit approved by the Minister). The largest deposits are: Zatoka Gdańska (472 ha) located on the Baltic Sea, Pławniowice (180 ha) in Śląskie Voivodeship, Kozin IV (123 ha) in Pomorskie Voivodeship, Siemianice (101 ha) in Wielkopolskie Voivodeship. The total area of the deposits crossed out from “The balance…” in 2024 was equal about 766 ha.
The biggest numbers of deposits are nowadays documented in the following Voivodeships (in descending sequence): Mazowieckie - 1,530, Wielkopolskie - 1,345, Lubelskie - 1,017, Warmińsko-Mazurskie - 889, Podlaskie - 871 and Łódzkie - 866.
Voivodeships with the largest documented resources volumes are: Dolnośląskie (2,341 million tonnes), Podlaskie (1,824 million tonnes), Małopolskie (1,862 million tonnes), Opolskie (1,511 million tonnes), Mazowieckie (1,484 million tonnes) and Zachodniopomorskie (1,460 million tonnes).
Resources of deposits covered by a detailed exploration (A, B and C1 categories) are equal 13,834.32 million tonnes and account for 64.8% of the total resources. Resources covered by the preliminary exploration (C2 and D categories) account for 35.2% of the total resources and amount to 7,528.08 million tonnes. Resources of exploited deposits, being equal 6,275.45 million tonnes (growth by 1.98 million tonnes in comparison with 2023), account for 29.4% of the total resources. Non-exploited deposits contain 12,839.28 million tonnes (60.1%) of resources (drop by -2.21 million tonnes), whereas resources of abandoned deposits are equal 2,247.67 million tonnes – growth by 110.90 million tonnes.
Economic resources amounted in 2024 to 4,400.51 million tonnes. Economic resources, established for the exploited deposits, are equal 3,670.09 million tonnes, whereas anticipated economic resources within the exploited deposits are equal 6,275.45 million tonnes. The distribution of resources (anticipated economic, economic and anticipated economic of exploited deposits within exploited deposits in particular Voivodeships as of the end of 2024 was as follows:
|
Voivodeship/ Region
|
Resources of exploited deposits (million tonnes)
|
||
| Anticipated economic | Economic | Anticipated economic of exploited deposits |
|
| Poland | 6,275.45 | 3,670.09 | 4,764.53 |
| Baltic Sea | 82.92 | 81.97 | 45.19 |
| Dolnośląskie | 652.17 | 303.54 | 551.66 |
| Kujawsko-Pomorskie | 156.05 | 103.37 | 115.30 |
| Lubelskie | 172.27 | 92.29 | 145.09 |
| Lubuskie | 321.83 | 176.95 | 181.12 |
| Łódzkie | 332.27 | 202.14 | 274.45 |
| Małopolskie | 414.57 | 115.53 | 324.78 |
| Mazowieckie | 445.16 | 292.33 | 271.25 |
| Opolskie | 310.38 | 139.96 | 300.82 |
| Podkarpackie | 259.84 | 108.76 | 211.21 |
| Podlaskie | 905.23 | 579.31 | 616.94 |
| Pomorskie | 451.95 | 336.82 | 361.68 |
| Śląskie | 226.54 | 86.87 | 181.00 |
| Świętokrzyskie | 87.96 | 47.86 | 82.43 |
| Warmińsko-Mazurskie | 393.11 | 328.17 | 274.83 |
| Wielkopolskie | 497.60 | 300.19 | 368.66 |
| Zachodniopomorskie | 565.64 | 374.03 | 458.13 |
In 2024, output of sand and gravel amounted to 180.1 million tonnes. In comparison with the previous year the exploitation increased by more than 13 million tonnes, that is by 7.8%. The output grew in 12 Voivodeships, whereas dropped in remaining 4 Voivodeships and on the Baltic Sea. The most significant increases were recorded in the following Voivodeships: Podlaskie, Pomorskie, Lubelskie and Zachodniopomorskie. In particular Voivodeships the output balance in 2024 is as follows:
|
The output
in comparison with 2023 |
The difference (thousand tonnes) |
The difference (%) |
| Total | 13,022.15 | 7.79 |
| Podlaskie Voivodeship | 5,580.75 | 19.70 |
| Pomorskie Voivodeship | 2,252.78 | 11.95 |
| Lubelskie Voivodeship | 1,959.92 | 33.83 |
| Zachodniopomorskie Voivodeship | 1,644.35 | 14.27 |
| Lubuskie Voivodeship | 892.56 | 19.47 |
| Warmińsko-Mazurskie Voivodeship | 711.54 | 5.20 |
| Podkarpackie Voivodeship | 622.84 | 7.30 |
| Łódzkie Voivodeship | 577.02 | 6.87 |
| Małopolskie Voivodeship | 486.69 | 4.42 |
| Opolskie Voivodeship | 456.65 | 6.45 |
| Mazowieckie Voivodeship | 340.03 | 2.90 |
| Śląskie Voivodeship | 142.16 | 2.70 |
| Świętokrzyskie Voivodeship | -44.34 | -2.15 |
| Baltic Sea | -96.10 | -12.20 |
| Wielkopolskie Voivodeship | -138.24 | -1.24 |
| Dolnośląskie Voivodeship | -1,000.06 | -8.16 |
| Kujawsko-Pomorskie Voivodeship | -1,366.40 | -22.54 |
The number of sand and gravel deposit in 2024 amounted to 11,216 including 2,448 of exploited deposits (in this group there are deposits crossed out from the actual registry and those for which the concessions were abolished and the deposits were marked as abandoned). In comparison with the previous year (2,497 deposits) the number decreased. The number of non-exploited deposits increased by 148 (from 8,620 in 2023 to 8,768 in 2024; Table 2).
Natural sand and gravel are also obtained during the exploitation of brown coal deposits. In 2024, the output of the raw material from non-documented deposits during the exploitation in the Bełchatów mine from the Szczerców field amounted to 857.28 thousand tonnes of natural aggregates: sandy, sandy-gravelly and gravell-sandy. The volume obtained in the Turów mine was equal 1.1 thousand tonnes.
Figure below shows changes in domestic resources and production of sand and gravel in Poland in the years 1989-2024.
The prognostic resources of the natural sandy-gravelly aggregates are assessed to be equal more than 13 billion tonnes*. They occur quite evenly in Poland. The areas of the prospective raw material occurrences, in contrast to the prognostic ones, are of a lower exploration category – due to the evaluation based on the indirect indicators, the lack of quality tests and non-assessed resources amount.
Prepared by: Wojciech Miśkiewicz, Dariusz Brzeziński, Anna Kalinowska, Joanna Stawierej, Wojciech Szczygielski
* Kozłowska O., Smakowski T., Miśkiewicz W., 2020 – ‘Kruszywo naturalne piaskowo-żwirowe (natural aggregates)’. In: ‘Bilans perspektywicznych zasobów kopalin Polski wg stanu na 31.12.2018 r.’ (eds. Szamałek K., Szuflicki M., Mizerski W.): 258-275. PIG-PIB, Warszawa [in Polish].
2023
General information and occurrence
Two major groups of natural sandy-gravelly aggregates are differentiated: a coarse aggregate group, comprising gravel and sand-gravel mix (sandy-gravelly aggregates), and that of fine aggregates – sandy. Sand deposits in Poland are usually evenly arranged and only southern voivodeships are characterized by their shortage. In turn, the course aggregates deposits – particularly marketable – occur unevenly and especially central voivodeships are characterized by the deficiency.
The bulk of Polish natural sand and gravel deposits are of the Quaternary age. The share of deposits of the older formations: the Pliocene, Miocene and Liassic in the age is subordinate.
The quality of the raw material, and especially deposits homogeneity, depends largely on a genetic type of a given deposit. Among the Quaternary deposits, there are 3 genetic types differentiated: glacial, fluvioglacial and fluvial (river). They are characterized by a zonality of the occurrence.
In the southern part of Poland, in the Carpathian-Sudetic zone, the most important are deposits of the fluvial (river) origin. In the Sudety Mts., the deposits of sandy-gravelly higher terraces of the Pleistocene age prevail, built mainly of the crystalline rocks and sandstones. In turn, in the Carpathian region the main raw material basis comprises gravelly and sandy-gravelly deposits occurring on flood-plain terraces as well as valley side terraces rising above flood plains. The Carpathian deposits are characterized by a predominance of the material coming from a disintegration of flysch rocks, except for those of the Dunajec River valley, showing a fairly high contribution of the crystalline rocks from the Tatry Mts.
In northern and central Poland – on the Polish Lowlands, the most important are deposits of a glacial (an accumulation platform of front moraine), fluvioglacial (sandrs, eskers) and fluvial (river) origin. Deposits from the northern part of that area are represented by gravelly-sandy accumulations mainly comprising the Scandinavian material – debris of crystalline rocks and limestones with an admixture of quartz and sandstones. In the central and southern parts of this region, the deposits are mainly formed of sandy sediments with a significant contribution of a debris of local rocks.
The deposits of a high quality natural sandy-gravelly aggregates are also located on the Polish maritime area (Baltic Sea). They are of the fluvioglacial processes and the selection of the maritime sediments origin. They are characterized by the isolated form of deposits fields with irregular shape and varying thickness.
According to the Regulation of the Minister of the Environment of the 1st of July 2015 regarding the geological documentation of a raw material deposit, excluding a hydrocarbons field (Journal of Laws 2015, Item 987), establishing i.a. the limit values of the parameters that define the deposit and its boundaries, a feldspar-quartzitic sand deposit with the sand content above 75% should be characterized by the thickness not smaller than 2 m with the ratio of overburden to deposit thickness not higher than 0.3 and the content of mineral silts fraction below 10%; whereas a gravelly, gravelly-sandy and sandy-gravelly deposit with the sand content below 75% should be characterized by the thickness not smaller than 2 m with the ratio of overburden to deposit thickness not higher than 1.0 and the content of mineral silts fraction below 15%.
The sand and gravel deposits occurrence in Poland is presented on the map.
Resources and output
Table 1 shows resources and the current state of exploration and development of natural sand and gravel aggregates.
The anticipated economic resources of natural aggregates as of 31.12.2023 totaled 21,131.80 million tonnes. The resources increased by 467.79 million tonnes (that is by 2.26%) in relation to the previous year. The growth dynamism decreased in comparison with the previous year when it was equal 2.34%.
The natural sandy-gravelly aggregates have been documented within 4 subtypes: sands, sand with gravel, gravel, loamy and silty sands. The resources of sands with the sand content above 75% amount to 10,404.72 million tonnes (increased by 268.76 million tonnes in comparison with 2022) from which 2,708.68 million tonnes are within exploited deposits. The resources of gravelly-sandy and sandy-gravelly aggregates with the sand content between 30% and 75% amount to 9,713.29 million tonnes (the growth by 201.08 million tonnes). The resources of gravel (with the sand content 30%) amount to 975.70 million tonnes (the drop by 2.11 million tonnes) and the resources of silty, loamy sands amounted to 38.09 million tonnes (the growth by 0.06 million tonnes).
The resources increased due to:
- The including into “The balance…” 334 newly documented deposits with the total resources equal above 646 million tonnes. In 2023, the largest resources were documented in Zachodniopomorskie Voivodeship (85.6 million tonnes within 13 deposits). The biggest deposit is Ponikiew I (69.5 million tonnes). In the following deposits: Chlewice 1, Gwiazdowo I, Nobliny, Sułomino, there were from 1.14 million tonnes to 5.12 million tonnes of resources documented. In the second best, regarding new deposits, Pomorskie Voivodeship, there were documented 70.9 million tonnes (21 new deposits). The biggest of these deposits are as follows: Trzebielsk II (12.42 million tonnes), Gapowo XX (9.7 million tonnes), Bukówka 2 (8.1 million tonnes), Gołębiewo VI (6.25 million tonnes), Gostomie XXI (5.92 million tonnes), Zagórki VI (5.89 million tonnes), Niepoczołowice-Linia (5.33 million tonnes). The resources of 12 out of all biggest newly documented deposits are equal above 67 million tonnes In the 3rd place, in terms of newly documented resources, there is Dolnośląskie Voivodeship: 70.1 million tonnes in 10 deposits. The biggest newly documented deposit is Brochocin (49.53 million tonnes). In the following deposits: Kościelniki Dolne, Piotrowice MD, Piotrowice AD, Raszówka, Dankowice I, Ścinawka Dolna KH there were resources within a range of 1.06-5.04 million tonnes documented. Except for the above mentioned deposits, the largest documented deposits were: Ruda 1 (16.79 million tonnes) in Śląskie Voivodeship, Gromiec (15.97 million tonnes) and Olewin (11.18 million tonnes) in Małopolskie Voivodeship, Bratkowice I (14.01 million tonnes) in Podkarpackie Voivodeship, Borowica II (11.73 million tonnes) in Lubelskie Voivodeship. The smallest resources volume, i.e. 0.31 million tonnes, was documented in Opolskie Voivodeship (1 deposit), in Świętokrzyskie Voivodeship 0.6 million tonnes (4 deposits), in Łódzkie Voivodeship 10.67 million tonnes (20 deposits). The deposits resources approved in 2023 by the Marshalls of Voivodeships amounted to 603.6 million tonnes (183 deposits), by the county mayors amounted to 41.2 million tonnes (151 deposits).
- The verification and updating of resources due to deposit area enlargement or deepening of its range, the resources updating as a result of a longtime exploitation, the change of a deposit usage and its designation in the site management plans within the borders of which the deposit was documented, or the resources settlement after an allocation of new deposits documented within the area of previously explored. The most significant resources growths coming from new geological documentations (supplements) were recorded for the following deposits: Sobololewo-Krzywe (25.59 million tonnes) located in Podlaskie Voivodeship, Przeciszów (17.93 million tonnes) in Małopolskie Voivodeship, Szczytniki (16.65 million tonnes) in Dolnośląskie Voivodeship, Głębocko I-1 (15.69 million tonnes) in Opolskie Voivodeship. Within 30 deposits, the resources increased from about 1 million tonnes to above 9 million tonnes each, whereas within 45 deposits within the range of about 0.1-0.9 million tonnes.
- The balance of the resources drops and growths, established in the new documentations with recalculated resources (supplements) or being the results of the current resources verification connected with exploitation – 78.1 million tonnes.
The resources decreased by:
- The output (167.08 million tonnes).
- The crossing 192 aggregate deposits out from the domestic registry – about 89 million tonnes in total. The biggest resources volumes were crossed out from the i.a. deposits: Lubin (-15.2 million tonnes) located in Lubuskie Voivodeship, Kondrajec Szlachecki (-4.26 million tonnes) and Morawy Wielkie II (-4.16 million tonnes) in Mazowieckie Voivodeship and Trzydniaki (-4 million tonnes) in Małopolskie Voivodeship. In 17 deposits, including 3 deposits above mentioned, there were from 1 million tonnes to 4.26 million tonnes of anticipated economic resources crossed out. In 35 deposits crossed out from the registry, resources were equal a dozen or so thousand tonnes or there were no documented resources at all.
- The resources reduced by new documentations (supplements) with recalculated resources elaborated for i.a. deposits: Legnica-Pole Wschodnie (-17.34 million tonnes) and Lenartowice (-12.35 million tonnes) in Dolnośląskie Voivodeship, Wola (-9.5 million tonnes) in Śląskie Voivodeship. Drops in 13 deposits contained the resources from about 1 million tonnes to 4.9 million tonnes, whereas in 36 deposits within a range between about 0.1-0.9 million tonnes.
The resources growth in Poland, similarly to the previous years, was a result of the increases of documented resources in most of Voivodeships. The most significant increases were recorded in the following Voivodeships: Zachodniopomorskie, Podkarpackie, Podlaskie, Lubelskie. The domestic economic resources decreased by -7.36 million tonnes in total. The growths of these resources were recorded in 6 Voivodeship, whereas decreases in the remaining ones and on Baltic Sea. The most significant economic resources drops were noted in Łódzkie, Podlaskie, Kujawsko-Pomorskie and Lubuskie Voivodeships. The tables below shows changes within anticipated economic resources and economic resources in particular Voivodeships in 2023:
Changes in anticipated economic resources
|
Increases (thousand tonnes)
|
Decreases (thousand tonnes)
|
||
| Zachodniopomorskie Voivodeship | 86,870 | Kujawsko-Pomorskie Voivodeship | -5,263 |
| Podkarpackie Voivodeship | 58,725 | Łódzkie Voivodeship | -3,705 |
| Podlaskie Voivodeship | 53,635 | Świętokrzyskie Voivodeship | -2,310 |
| Lubelskie Voivodeship | 44,278 | Baltic Sea | -630 |
| Dolnośląskie Voivodeship | 43,097 | ||
| Pomorskie Voivodeship | 38,368 | ||
| Mazowieckie Voivodeship | 36,365 | ||
| Małopolskie Voivodeship | 33,926 | ||
| Wielkopolskie Voivodeship | 28,456 | ||
| Lubuskie Voivodeship | 25,550 | ||
| Opolskie Voivodeship | 13,701 | ||
| Warmińsko-Mazurskie Voivodeship | 8,752 | ||
| Śląskie Voivodeship | 7,973 | ||
| Total increases | 479,695 | Total decreases | -11,908 |
Changes in economic resources
|
Increases (thousand tonnes)
|
Decreases (thousand tonnes)
|
||
| Pomorskie Voivodeship | 40,290 | Łódzkie Voivodeship | -15,466 |
| Świętokrzyskie Voivodeship | 8,470 | Podlaskie Voivodeship | -14,526 |
| Lubelskie Voivodeship | 4,613 | Kujawsko-Pomorskie Voivodeship | -10,213 |
| Zachodniopomorskie Voivodeship | 4,351 | Lubuskie Voivodeship | -10,060 |
| Mazowieckie Voivodeship | 2,819 | Opolskie Voivodeship | -7,132 |
| Śląskie Voivodeship | 938 | Warmińsko-Mazurskie Voivodeship | -6,566 |
| Małopolskie Voivodeship | -2,633 | ||
| Podkarpackie Voivodeship | -667 | ||
| Baltic Sea | -630 | ||
| Wielkopolskie Voivodeship | -499 | ||
| Dolnośląskie Voivodeship | -445 | ||
| Total increases | 61,481 | Total decreases | -68,837 |
In the deposits which were included into current edition of “The balance…” there was mainly sand documented in the volume exceeding 406 million tonnes from which the biggest deposits are: Brochocin (49.5 million tonnes) located in Dolnośląskie Voivodeship, Cieszów-Turów I (36.61 million tonnes) in Lubuskie Voivodeship. The resources of sand and gravel in new deposits are equal 237 million tonnes in i.a. deposits: Ponikiew I (69.51 million tonnes) located in Zachodniopomorskie Voivodeship and Wąsosz 9 (20.37 million tonnes) in Podlaskie Voivodeship. New gravel resources amounted to 3 million tonnes and the biggest deposits are: Zawiar (2.27 million tonnes) in Podkarpackie Voivodeship and Stary Sącz-Moszczenica 3 (0.5 million tonnes) in Małopolskie Voivodeship. The Voivodeship distribution of the subtypes resources of the new deposits is presented below:
|
Voivodeship/Region
|
Sand (million tonnes) |
Sand with gravel (million tonnes) |
Gravel (million tonnes) |
Silty, loamy sand (million tonnes) |
| Baltic Sea | - | - | - | - |
| Dolnośląskie | 64.0 | 6.1 | - | - |
| Kujawsko-Pomorskie | 11.2 | - | - | - |
| Lubelskie | 46.9 | - | - | - |
| Lubuskie | 45.7 | 6.7 | - | - |
| Łódzkie | 10.7 | - | - | - |
| Małopolskie | 2.8 | 32.4 | 0.8 | - |
| Mazowieckie | 46.4 | 11.0 | - | - |
| Opolskie | 0 | 0.3 | - | - |
| Podkarpackie | 63.3 | 2.7 | 2.3 | - |
| Podlaskie | 16.5 | 36.0 | - | - |
| Pomorskie | 41.9 | 28.8 | - | 0.2 |
| Śląskie | 4.9 | 22.6 | - | - |
| Świętokrzyskie | 0.6 | - | - | - |
| Warmińsko-Mazurskie | 6.0 | 20.6 | - | - |
| Wielkopolskie | 29.5 | - | - | - |
| Zachodniopomorskie | 15.8 | 69.8 | - | - |
The total area of the deposits included into “The balance…” in 2023 amounted to about 3,006 ha, including 2,741 ha (183 deposits) of the deposits with the area above 2 ha and 266 ha (151 deposits) of the deposits below 2 ha. The biggest deposits are: Ponikiew I (240 ha) located in Zachodniopomorskie Voivodeship, Cieszów-Turów I (170 ha) in Lubuskie Voivodeship, Brochocin (123 ha) in Dolnośląskie Voivodeship. The total area of the deposits crossed out from “The balance…” in 2023 was equal about 937 ha.
The biggest numbers of deposits are nowadays documented in the following Voivodeships: Mazowieckie (1,517), Wielkopolskie (1,326), Lubelskie (1,003), Warmińsko-Mazurskie (877), Podlaskie (871) and Łódzkie (860).
Voivodeships with the biggest documented resources volumes are: Dolnośląskie (2,337 million tonnes), Podlaskie (1,853 million tonnes), Małopolskie (1,830 million tonnes), Opolskie (1,501 million tonnes), Mazowieckie (1,465 million tonnes) and Zachodniopomorskie (1,460 million tonnes).
The resources of deposits covered by a detailed exploration (A, B and C1 categories) are equal 13,572.12 million tonnes and account for 64.2% of the total resources. The resources covered by the preliminary exploration (C2 and D categories) account for 35.77% of the total resources and amount to 7,559.68 million tonnes. The resources of exploited deposits, being equal 6,153.54 million tonnes (the drop by 1.57 million tonnes in comparison with 2022), account for 29.1% of the total resources. Non-exploited deposits contain 12,841.49 million tonnes (60.8%) of resources (the growth by 296.3 million tonnes), whereas the resources of abandoned deposits are equal 2,136.77 million tonnes – the growth by 269.81 million tonnes.
The economic resources amounted in 2023 to 4,329.90 million tonnes. The economic resources, established for the exploited deposits, are equal 3,497.31 million tonnes, whereas the anticipated economic resources within the exploited deposits are equal 4,625.45 million tonnes The distribution of resources (anticipated economic, economic and anticipated economic of exploited deposits – in million tonnes) within exploited deposits in particular Voivodeships as of the end of 2023 was as follows:
|
Voivodeship/ Region
|
Resources of exploited deposits (million tonnes)
|
||
| Anticipated economic | Economic | Anticipated economic of exploited deposits |
|
| Poland | 6,153.54 | 3,497.31 | 4,625.45 |
| Baltic Sea | 83.43 | 82.48 | 45.70 |
| Dolnośląskie | 664.29 | 311.65 | 594.30 |
| Kujawsko-Pomorskie | 165.87 | 108.67 | 115.61 |
| Lubelskie | 168.79 | 89.97 | 142.25 |
| Lubuskie | 307.04 | 153.40 | 168.60 |
| Łódzkie | 334.11 | 201.07 | 272.62 |
| Małopolskie | 429.95 | 133.15 | 330.21 |
| Mazowieckie | 427.27 | 272.81 | 262.79 |
| Opolskie | 293.31 | 104.27 | 286.56 |
| Podkarpackie | 258.69 | 110.67 | 179.46 |
| Podlaskie | 902.40 | 520.02 | 563.77 |
| Pomorskie | 418.54 | 338.75 | 342.58 |
| Śląskie | 233.90 | 93.08 | 183.70 |
| Świętokrzyskie | 89.32 | 48.63 | 84.68 |
| Warmińsko-Mazurskie | 405.90 | 328.92 | 286.94 |
| Wielkopolskie | 469.17 | 284.23 | 356.11 |
| Zachodniopomorskie | 501.57 | 315.55 | 409.58 |
In 2023, the output of sand and gravel amounted to 167.08 million tonnes. In comparison with the previous year the exploitation decreased by 3.7 million tonnes, that is by 2.2%. The output grew in 7 Voivodeships, whereas dropped in remaining 9 Voivodeships and on the Baltic Sea. The most significant drops were recorded in the following Voivodeships: Dolnośląskie, Mazowieckie, Warmińsko-Mazurskie, Pomorskie, Zachodniopomorskie. In particular Voivodeships the output balance in comparison with 2022 is as follows:
|
The output
in comparison with 2022 |
The difference (thousand tonnes) |
The difference (%) |
| Total | -3,699 | -2.2 |
| Podlaskie Voivodeship | 3,350 | 13.4 |
| Lubelskie Voivodeship | 897 | 18.3 |
| Wielkopolskie Voivodeship | 452 | 4.2 |
| Opolskie Voivodeship | 411 | 6.2 |
| Śląskie Voivodeship | 245 | 4.9 |
| Podkarpackie Voivodeship | 142 | 1.7 |
| Łódzkie Voivodeship | 95 | 1.1 |
| Baltic Sea | -48 | -5.8 |
| Świętokrzyskie Voivodeship | -83 | -3.9 |
| Kujawsko-Pomorskie Voivodeship | -194 | -3.1 |
| Małopolskie Voivodeship | -897 | -7.5 |
| Lubuskie Voivodeship | -981 | -17.6 |
| Zachodniopomorskie Voivodeship | -1,001 | -8.0 |
| Pomorskie Voivodeship | -1,097 | -5.5 |
| Warmińsko-Mazurskie Voivodeship | -1,357 | -9.0 |
| Mazowieckie Voivodeship | -1,449 | -11.0 |
| Dolnośląskie Voivodeship | -2,183 | -15.1 |
Regarding the division of deposits to the subtypes, the most intensive exploitation was recorded for sand with gravel deposits (the sand content between 30% and 75%) – 84.8 million tonnes, then for sand deposits (the sand content >75%) – 77.7 million tonnes and gravel deposits – 4.3 million tonnes. The detailed division in particular Voivodeships is presented below:
|
Voivodeship/Region
|
Sand (million tonnes) |
Sand with gravel (million tonnes) |
Gravel (million tonnes) |
Silty, loamy sand (million tonnes) |
| Baltic Sea | - | 0.8 | - | - |
| Dolnośląskie | 3.7 | 8.0 | 0.5 | 0 |
| Kujawsko-Pomorskie | 5.7 | 0.3 | - | - |
| Lubelskie | 5.6 | 0.2 | - | 0 |
| Lubuskie | 2.4 | 2.2 | - | - |
| Łódzkie | 7.1 | 1.3 | - | - |
| Małopolskie | 0.3 | 9.0 | 1.7 | - |
| Mazowieckie | 9.3 | 2.5 | - | - |
| Opolskie | 1.2 | 4.6 | 1.3 | 0 |
| Podkarpackie | 3.5 | 4.2 | 0.7 | 0.1 |
| Podlaskie | 4.8 | 23.6 | - | - |
| Pomorskie | 9.5 | 9.3 | - | 0 |
| Śląskie | 1.4 | 3.8 | 0.1 | - |
| Świętokrzyskie | 2.0 | - | - | 0 |
| Warmińsko-Mazurskie | 1.8 | 11.9 | - | - |
| Wielkopolskie | 10.4 | 0.8 | - | - |
| Zachodniopomorskie | 9.0 | 2.3 | - | 0.2 |
The number of sand and gravel deposit in 2023 amounted to 11,117 including 2,497 of exploited deposits (in this group there are deposits crossed out from the actual balance and those for which the concessions expired and the deposits were marked as abandoned). In comparison with the previous year (2,540 deposits) the number decreased. The number of non-exploited deposits increased by 161 (from 8,459 in 2022 to 8,620 in 2023).
Natural sand and gravel are also obtained during the exploitation of brown coal deposits. In 2023, the output of the raw material from non-documented deposits during the exploitation in the Bełchatów mine from the Szczerców field amounted to 910.33 thousand tonnes of sand, sand with gravel and gravel with sand.
Figure below shows changes in domestic resources and production of sand and gravel in Poland in the years 1989-2023.
The prognostic resources of the natural sandy-gravelly aggregates are assessed to be equal more than 13 billion tonnes*. They occur quite evenly in Poland. The areas of the prospective raw material occurrences, in contrast to the prognostic ones, are of a lower exploration category – due to the evaluation based on the indirect indicators, the lack of quality tests and non-assessed resources amount.
Prepared by: Wojciech Miśkiewicz, Dariusz Brzeziński, Anna Kalinowska, Joanna Stawierej, Wojciech Szczygielski
* Kozłowska O., Smakowski T., Miśkiewicz W., 2020 – ‘Kruszywo naturalne piaskowo-żwirowe (natural aggregates)’. In: ‘Bilans perspektywicznych zasobów kopalin Polski wg stanu na 31.12.2018 r.’ (eds. Szamałek K., Szuflicki M., Mizerski W.): 258-275. PIG-PIB, Warszawa [in Polish].
2022
General information and occurrence
Two major groups of natural sandy-gravelly aggregates are differentiated: a coarse aggregate group, comprising gravel and sand-gravel mix (sandy-gravelly aggregates), and that of fine aggregates – sandy. Sand deposits in Poland are usually evenly arranged and only southern voivodeships are characterized by their shortage. In turn, the course aggregates deposits – particularly marketable – occur unevenly and especially central voivodeships are characterized by the deficiency.
The bulk of Polish natural sand and gravel deposits are of the Quaternary age. The share of deposits of the older formations: the Pliocene, Miocene and Liassic in the age is subordinate.
The quality of the raw material, and especially deposits homogeneity, depends largely on a genetic type of a given deposit. Among the Quaternary deposits, there are 3 genetic types differentiated: glacial, fluvioglacial and fluvial (river). They are characterized by a zonality of the occurrence.
In the southern part of Poland, in the Carpathian-Sudetic zone, the most important are deposits of the fluvial (river) origin. In the Sudety Mts., the deposits of sandy-gravelly higher terraces of the Pleistocene age prevail, built mainly of the crystalline rocks and sandstones. In turn, in the Carpathian region the main raw material basis comprises gravelly and sandy-gravelly deposits occurring on flood-plain terraces as well as valley side terraces rising above flood plains. The Carpathian deposits are characterized by a predominance of the material coming from a disintegration of flysch rocks, except for those of the Dunajec River valley, showing a fairly high contribution of the crystalline rocks from the Tatry Mts.
In northern and central Poland – on the Polish Lowlands, the most important are deposits of a glacial (an accumulation platform of front moraine), fluvioglacial (sandrs, eskers) and fluvial (river) origin. Deposits from the northern part of that area are represented by gravelly-sandy accumulations mainly comprising the Scandinavian material – debris of crystalline rocks and limestones with an admixture of quartz and sandstones. In the central and southern parts of this region, the deposits are mainly formed of sandy sediments with a significant contribution of a debris of local rocks.
The deposits of a high quality natural sandy-gravelly aggregates are also located on the Polish maritime area (Baltic Sea). They are of the fluvioglacial processes and the selection of the maritime sediments origin. They are characterized by the isolated form of deposits fields with irregular shape and varying thickness.
According to the Regulation of the Minister of the Environment of the 1st of July 2015 regarding the geological documentation of a raw material deposit, excluding a hydrocarbons field (Journal of Laws 2015, Item 987), establishing i.a. the limit values of the parameters that define the deposit and its boundaries, a feldspar-quartzitic sand deposit with the sand content above 75% should be characterized by the thickness not smaller than 2 m with the ratio of overburden to deposit thickness not higher than 0.3 and the content of mineral silts fraction below 10%; whereas a gravelly, gravelly-sandy and sandy-gravelly deposit with the sand content below 75% should be characterized by the thickness not smaller than 2 m with the ratio of overburden to deposit thickness not higher than 1.0 and the content of mineral silts fraction below 15%.
The sand and gravel deposits occurrence in Poland is presented on the map.
Resources and output
Table 1 shows resources and the current state of exploration and development of natural sand and gravel aggregates.
The anticipated economic resources of natural aggregates as of 31.12.2022 totaled 20,664.01 million tonnes. The resources increased by 471.78 million tonnes (that is by 2.34%) in relation to the previous year. The growth dynamism increased in comparison with the previous year when it was equal 1.16%.
The natural sandy-gravelly aggregates have been documented within 4 subtypes: sands, sand with gravel, gravel, loamy and silty sands. The resources of sands with the sand content above 75% amount to 10,135.96 million tonnes (increased by 480.62 million tonnes in comparison with 2021) from which 2,831.42 million tonnes are within exploited deposits. The resources of gravelly-sandy and sandy-gravelly aggregates with the sand content between 30% and 75% amount to 9,512.21 million tonnes (the drop by 3.55 million tonnes). The resources of gravel (with the sand content <30%) amount to 977.81 million tonnes (the drop by −5.72 million tonnes) and the resources of silty, loamy sands amounted to 38.03 million tonnes (the growth by 0.42 million tonnes).
The resources increased due to:
- The including into ‘The balance…’ 340 newly documented deposits with the total resources equal above 725.8 million tonnes. In 2022, the largest resources were documented on the Polish maritime area (Baltic Sea). For the first time in 30 years there were 2 deposits documented at the bottom of the Baltic Sea: Zatoka Gdańska – obszar 1 (110.97 million tonnes) and Zatoka Gdańska – obszar 2 (187.83 million tonnes). In the second best, regarding the resources growth, Podlaskie Voivodeship, there were documented 61.37 million tonnes (35 new deposits). The biggest of these deposits are as follows: Kamionka-Drahle 3 (26.36 million tonnes), Zielone Kamedulskie VIII (9.95 million tonnes). In the following deposits: Szymany III, Rogawka IX, Jasieniówka, Żyrwiny VI documented resources were equal 2.97 million tonnes. The resources of 11 out of all biggest newly documented deposits are equal nearly 53 million tonnes (within a range between 1.09 million tonnes and 26.36 million tonnes), that is 87% of the newly documented resources in the Voivodeship. Remaining 24 deposits contain the resources within a range of 0.09-0.9 million tonnes. In the third place, in terms of newly documented resources, there is Pomorskie Voivodeship: 45.94 million tonnes (26 deposits). The biggest newly documented deposits are: Wieprznica IIIA (13.03 million tonnes), Jałowiec II (7.01 million tonnes). However, the following deposits: Żelazno I, Dęby I, Minkowice I, Szczukowo II and Demlin XI contain the resources within a range of 2.23-2.69 million tonnes. The smallest resources volume, i.e. 2.63 million tonnes, was documented in Świętokrzyskie Voivodeship (4 deposits), Śląskie Voivodeship – 5.47 million tonnes (6 deposits), Lubuskie Voivodeship – 7.59 million tonnes (4 deposits). The deposits resources approved in 2022 by the Marshalls Voivodeships amounted to 385.9 million tonnes (176 deposits), by the county mayors amounted to 40.9 million tonnes (161 deposits) and by the Minister of the Climate and Environment amounted to 298.8 million tonnes (2 deposits).
- The verification and updating of resources due to the deposit area enlargement or deepening of its range, the resources updating as a result of a longtime exploitation, the change of a deposit usage and its designation in the site management plans within the borders of which the deposit was documented, or the resources settlement after an allocation of new deposits documented within the area of previously explored. The most significant resources growths coming from new geological documentations (the supplements to documentations) were recorded for the following deposits: Ginawa (36.98 million tonnes) located in Zachodniopomorskie Voivodeship, Drogoszów II (6.85 million tonnes) located in Opolskie Voivodeship, Rywociny (10.19 million tonnes) and Zbiroża X located in Mazowieckie Voivodeship, Brzeszcze-Buczaki (4.04 million tonnes) located in Małopolskie Voivodeship. Moreover: the Ratajki V deposit in Zachodniopomorskie Voivodeship, the Józefkowo I deposit in Kujawsko-Pomorskie Voivodeship, the Rogawka and Mątwica VII deposits located in Podlaskie Voivodeship, the Gołaszyn and Owczary-p. Północne deposits located in Lubuskie Voivodeship, the Łazów I-Galicja located in Podkarpackie Voivodeship, the Potażniki RO and Dęby Szlacheckie-I deposits located in Wielkopolskie Voivodeship., the Ocice III deposit located in Dolnośląskie Voivodeship and the Trzebina 1 deposit located in Opolskie Voivodeship enlarged their resources from about 2 million tonnes to 4 million tonnes each.
- The balance of the resources drops and growths, established in the new documentations with recalculated resources (supplements) or being the results of the current resources verification connected with the exploitation – 51.1 million tonnes.
The resources decreased by:
- The output (170.78 million tonnes).
- The crossing 217 aggregate deposits out from the domestic resources balance – about 134.9 million tonnes in total. The biggest resources volumes were crossed out from the i.a. deposits: Deszczno-Łagodzin (−61.03 million tonnes), Deszczno-Łagodzin p. Krasowiec (−5.67 million tonnes) and Stężyca (−7.87 million tonnes) located in Lubuskie Voivodeship; Kanigowo VII (−8.87 million tonnes) in Warmińsko-Mazurskie Voivodeship; Wieprznica III (−4.98 million tonnes) in Pomorskie Voivodeship; Leżajsk – dz. 5754/82 (−2.64 million tonnes), Gniewczyna Łańcucka SW (−2.24 million tonnes) in Podkarpackie Voivodeship. In 15 deposits the remaining resources exceeded 1 million tonnes, in 54 deposits it the resources were within a range of 200-900 thousand tonnes, whereas in 38 deposits up to dozen thousand tonnes.
- The resources reduced by the new documentations with recalculated resources (the supplements) elaborated for i.a. deposits: Kalbornia-Mosznica (−4.07 million tonnes) and Różyńsk Wielki III (−5.14 million tonnes) in Warmińsko-Mazurskie Voivodeship, Olszna II-MK (−9.12 million tonnes) and Lasów-Żarka (−4.94 million tonnes) in Dolnośląskie Voivodeship, Borowiec (−5.51 million tonnes) in Małopolskie Voivodeship. The drops in 14 deposits contained the resources from about 1 million tonnes to 3.2 million tonnes, whereas in 19 deposits it was within a range between about 0.5 million tonnes and 9 million tonnes.
The resources growth in Poland, similarly to the previous years, was the result of the increases of documented resources in most of Voivodeships. The most significant increase was recorded on the Polish maritime area (Baltic Sea) and in the following Voivodeships: Zachodniopomorskie, Mazowieckie, Podlaskie, Opolskie. The table below shows changes within anticipated economic resources in particular Voivodeships in 2022.
|
Increases (thousand tonnes)
|
Decreases (thousand tonnes)
|
||
| Baltic Sea | 298,205 | Lubuskie Voivodeship | −68,710 |
| Zachodniopomorskie Voivodeship | 62,020 | Dolnośląskie Voivodeship | −13,694 |
| Mazowieckie Voivodeship | 42,374 | Śląskie Voivodeship | −2,138 |
| Podlaskie Voivodeship | 41,101 | ||
| Opolskie Voivodeship | 32,447 | ||
| Kujawsko-Pomorskie Voivodeship | 17,087 | ||
| Wielkopolskie Voivodeship | 15,020 | ||
| Lubelskie Voivodeship | 12,692 | ||
| Pomorskie Voivodeship | 11,318 | ||
| Małopolskie Voivodeship | 11,250 | ||
| Podkarpackie Voivodeship | 9,651 | ||
| Łódzkie Voivodeship | 2,026 | ||
| Świętokrzyskie Voivodeship | 1,114 | ||
| Warmińsko-Mazurskie Voivodeship | 16 | ||
| Total increases | 556,322 | Total decreases | −84,542 |
In the deposits which were included into current ‘The balance…’ there was mainly sand documented in the volume exceeding 569 million tonnes from which the biggest deposits are mentioned above Zatoka Gdańska – obszar 1 and Zatoka Gdańska – obszar 2. The resources of sand and gravel are equal 153 million tonnes in i.a. deposits: Kamionka-Drahle 3 (26.36 million tonnes) located in Podlaskie Voivodeship and Poborszów (24.28 million tonnes) located in Opolskie Voivodeship. New gravel resources amounted to 2.72 million tonnes and the biggest deposits are: Solarnia (0.93 million tonnes) in Opolskie Voivodeship and Sierakoście-V (0.9 million tonnes) in Podkarpackie Voivodeship. The Voivodeship distribution of the subtypes resources of the new deposits is presented below:
|
Voivodeship/Region
|
Sand (million tonnes) |
Sand with gravel (million tonnes) |
Gravel (million tonnes) |
Silty, loamy sand (million tonnes) |
| Baltic Sea | 298.8 | 0 | 0 | 0 |
| Dolnośląskie | 9.0 | 8.7 | 0 | 0 |
| Kujawsko-Pomorskie | 22.7 | 1.0 | 0 | 0 |
| Lubelskie | 23.1 | 0 | 0 | 0 |
| Lubuskie | 7.6 | 0 | 0 | 0 |
| Łódzkie | 13.3 | 2.0 | 0 | 0 |
| Małopolskie | 25.2 | 8.4 | 0.5 | 0 |
| Mazowieckie | 37.4 | 0.3 | 0 | 0 |
| Opolskie | 6.9 | 24.7 | 0.9 | 0 |
| Podkarpackie | 15.9 | 7.2 | 1.3 | 0 |
| Podlaskie | 16.9 | 44.5 | 0 | 0 |
| Pomorskie | 33.8 | 12.1 | 0 | 0 |
| Śląskie | 1.9 | 3.6 | 0 | 0 |
| Świętokrzyskie | 2.6 | 0 | 0 | 0 |
| Warmińsko-Mazurskie | 6.4 | 32.2 | 0 | 0 |
| Wielkopolskie | 17.0 | 1.1 | 0 | 0 |
| Zachodniopomorskie | 30.9 | 7.0 | 0 | 1.0 |
The total area of the deposits included into ‘The balance…’ in 2022 amounted to 6,795 ha, including 6,513 ha (165 deposits) of the deposits with the are above 2 ha and 282 ha (175 deposits) of the deposits below 2 ha. The biggest deposits are located at the bottom of the Baltic Sea: Zatoka Gdańska – obszar 2 (1,665 ha), and Poborszów (167 ha) located in Opolskie Voivodeship, Parsęcko V (83 ha) in Zachodniopomorskie Voivodeship, Zabawa Zawale (66 ha) in Małopolskie Voivodeship, Jałowiec II (56 ha) in Pomorskie Voivodeship. The total area of the deposits crossed out from ‘The balance…’ in 2022 was equal about 1,390 ha.
The biggest numbers of deposits are nowadays documented in the following Voivodeships: Mazowieckie (1,485), Wielkopolskie (1,306), Lubelskie (1,002), Warmińsko-Mazurskie (864), Podlaskie (856), Łódzkie (860).
The Voivodeships with the biggest documented resources are: Dolnośląskie (2,294 million tonnes), Podlaskie (1,800 million tonnes), Małopolskie (1,796 million tonnes), Opolskie (1,487 million tonnes), Mazowieckie (1,428 million tonnes) and Zachodniopomorskie (1,373 million tonnes).
The resources of deposits covered by a detailed exploration (A, B and C1 categories) are equal 13,101.96 million tonnes and account for 63.4% of the total resources. The resources covered by the preliminary exploration (C2 and D categories) account for 36.6% of the total resources and amount to 7,562.05 million tonnes. The resources of exploited deposits, being equal 6,251.87 million tonnes (the growth by 103.8 million tonnes in comparison with 2021), account for 30.3% of the total resources. Non-exploited deposits contain 12,545.18 million tonnes (60.7%) of resources (the growth by 308.5 million tonnes), whereas the resources of abandoned deposits are equal 1,866.96 million tonnes – the growth by 59.43 million tonnes.
The economic resources amounted in 2022 to 4,337.26 million tonnes and increased in comparison with the previous year by 12.83 million tonnes. The economic resources, established for the exploited deposits, are equal 3,618.64 million tonnes accounting for 58% of their documented resources, whereas the anticipated economic resources within the exploited deposits are equal 4,575.57 million tonnes The distribution of resources (anticipated economic, economic and anticipated economic of exploited deposits – in million tonnes) within exploited deposits in particular Voivodeships as of the end of 2022 was as follows:
|
Voivodeship/ Region
|
Developed resources (million tonnes)
|
||
| Anticipated economic | Economic | Anticipated economic of exploited deposits |
|
| Poland | 6,251.87 | 3,618.64 | 4,575.57 |
| Baltic Sea | 84.06 | 83.11 | 46.33 |
| Dolnośląskie | 676.56 | 349.37 | 590.58 |
| Kujawsko-Pomorskie | 176.36 | 119.27 | 127.52 |
| Lubelskie | 161.96 | 85.30 | 130.26 |
| Lubuskie | 332.16 | 162.09 | 195.69 |
| Łódzkie | 344.47 | 212.31 | 274.24 |
| Małopolskie | 422.59 | 130.83 | 328.97 |
| Mazowieckie | 430.05 | 270.48 | 300.23 |
| Opolskie | 281.03 | 115.19 | 271.59 |
| Podkarpackie | 268.65 | 117.29 | 203.30 |
| Podlaskie | 878.11 | 544.06 | 507.98 |
| Pomorskie | 418.04 | 329.00 | 330.79 |
| Śląskie | 273.49 | 92.13 | 179.08 |
| Świętokrzyskie | 89.04 | 38.35 | 78.48 |
| Warmińsko-Mazurskie | 410.44 | 341.73 | 268.77 |
| Wielkopolskie | 499.77 | 300.24 | 350.11 |
| Zachodniopomorskie | 505.08 | 327.89 | 391.65 |
In 2022, the output of sand and gravel amounted to 170.78 million tonnes. In comparison with the previous year the exploitation decreased by 14.3 million tonnes, that is by 7.7%, in contrast to 2021 when the output increased by 4.83 million tonnes. The output grew only in Pomorskie and Zachodniopomorskie Voivodeships and dropped in remaining 14 Voivodeships. The most significant drops were recorded in the following Voivodeships: Warmińsko-Mazurskie, Lubuskie, Łódzkie, Mazowieckie, Opolskie, Podkarpackie and Kujawsko-Pomorskie. In 2022, the demand for the raw materials decreased in industry areas using sandy-gravelly aggregates as: the infrastructure building sector, industrial building sector and production of concrete (i.a. ready-mix concrete) and concrete products. Nowadays, the significant part of the aggregates production absorb the large-scale infrastructure investments which, to some extent, stabilize the aggregates market. In particular Voivodeships the output balance in comparison with 2021 is as follows:
|
The output
in comparison with 2021 |
The difference (thousand tonnes) |
The difference (%) |
| Total | −14,299 | −7.7 |
| Pomorskie | 1,063 | 5.6 |
| Zachodniopomorskie | 578 | 4.8 |
| Małopolskie | −198 | −1.6 |
| Świętokrzyskie | −323 | −13.1 |
| Dolnośląskie | −636 | −4.2 |
| Baltic Sea | −666 | −44.3 |
| Podlaskie | −836 | −3.2 |
| Śląskie | −866 | −14.7 |
| Wielkopolskie | −947 | −8.1 |
| Lubelskie | −955 | −16.3 |
| Kujawsko-Pomorskie | −1,029 | −14.1 |
| Podkarpackie | −1,040 | −11.0 |
| Opolskie | −1,307 | −16.4 |
| Mazowieckie | −1,461 | −10.0 |
| Łódzkie | −1,506 | −15.4 |
| Lubuskie | −1,540 | −21.7 |
| Warmińsko-Mazurskie | −2,629 | −14.9 |
Regarding the division of deposits to the subtypes, the most intensive exploitation was recorded for sand with gravel deposits (the sand content between 30% and 75%) – 89.8 million tonnes, then for sand deposits (the sand content >75%) – 76.7 million tonnes and gravel deposits – 4 million tonnes. The detailed division in particular Voivodeships is presented below:
|
Voivodeship/Region
|
Sand (million tonnes) |
Sand with gravel (million tonnes) |
Gravel (million tonnes) |
Silty, loamy sand (million tonnes) |
| Baltic Sea | 0 | 0.8 | 0 | 0 |
| Dolnośląskie | 4.2 | 9.5 | 0.7 | 0 |
| Kujawsko-Pomorskie | 5.9 | 0.4 | 0 | 0 |
| Lubelskie | 4.7 | 0.2 | 0 | 0 |
| Lubuskie | 2.9 | 2.7 | 0 | 0 |
| Łódzkie | 6.8 | 1.5 | 0 | 0 |
| Małopolskie | 0.6 | 9.9 | 1.5 | 0 |
| Mazowieckie | 9.7 | 3.4 | 0 | 0 |
| Opolskie | 1.4 | 4.3 | 1.0 | 0 |
| Podkarpackie | 3.5 | 4.2 | 0.6 | 0.1 |
| Podlaskie | 3.4 | 21.6 | 0 | 0 |
| Pomorskie | 10.0 | 9.9 | 0 | 0 |
| Śląskie | 1.1 | 3.7 | 0.2 | 0 |
| Świętokrzyskie | 2.1 | 0 | 0 | 0 |
| Warmińsko-Mazurskie | 2.5 | 12.5 | 0 | 0 |
| Wielkopolskie | 10.0 | 0.7 | 0 | 0 |
| Zachodniopomorskie | 8.0 | 4.5 | 0 | 0.1 |
The number of sand and gravel deposit in 2022 amounted to 10,999 including 2,540 of exploited deposits (in this group there are deposits crossed out from the actual ‘balance and those for which the concessions expired and the deposits were marked as abandoned). In comparison with the previous year (2,608 deposits) the number decreased. The number of non-exploited deposits increased by 195 (from 8,264 in 2021 to 8,459 in 2022). The structure of the deposits divided according to the output volume in particular Voivodeships in 2022 is presented below:
|
Voivodeship/Region
|
Output (thousand tonnes)
|
Exploited deposits
|
|||||
|
<50
|
50-100
|
100-200
|
200-500
|
500-1,000
|
>1,000
|
Number
|
|
| Baltic Sea | 0 | 0 | 0 | 0 | 1 | 0 | 1 |
| Dolnośląskie | 59 | 7 | 18 | 10 | 8 | 1 | 103 |
| Kujawsko-Pomorskie | 102 | 18 | 12 | 5 | 0 | 0 | 137 |
| Lubelskie | 180 | 11 | 4 | 3 | 0 | 0 | 198 |
| Lubuskie | 26 | 8 | 11 | 3 | 3 | 0 | 51 |
| Łódzkie | 196 | 19 | 12 | 5 | 2 | 0 | 234 |
| Małopolskie | 38 | 15 | 12 | 18 | 4 | 0 | 87 |
| Mazowieckie | 328 | 22 | 21 | 8 | 3 | 0 | 382 |
| Opolskie | 20 | 9 | 3 | 9 | 4 | 0 | 45 |
| Podkarpackie | 142 | 22 | 14 | 9 | 0 | 0 | 187 |
| Podlaskie | 216 | 19 | 17 | 8 | 6 | 6 | 272 |
| Pomorskie | 95 | 23 | 29 | 12 | 5 | 2 | 166 |
| Śląskie | 24 | 5 | 6 | 9 | 1 | 0 | 45 |
| Świętokrzyskie | 42 | 0 | 4 | 1 | 1 | 0 | 48 |
| Warmińsko-Mazurskie | 125 | 15 | 15 | 10 | 4 | 2 | 171 |
| Wielkopolskie | 298 | 23 | 19 | 7 | 0 | 0 | 347 |
| Zachodniopomorskie | 31 | 8 | 6 | 14 | 5 | 2 | 66 |
| Total | 1,922 | 224 | 203 | 131 | 47 | 13 | 2,540 |
Natural sand and gravel are also obtained during the exploitation of brown coal deposits. In 2022, the output of the raw material from non-documented deposits during the exploitation in the Bełchatów mine from the Szczerców field amounted to 939.92 thousand tonnes of sand, sand with gravel and gravel with sand.
Figure below shows changes in domestic resources and production of sand and gravel in Poland in the years 1989-2022.
The prognostic resources of the natural sandy-gravelly aggregates are assessed to be equal more than 13 billion tonnes*. They occur quite evenly in Poland. The areas of the prospective raw material occurrences, in contrast to the prognostic ones, are of a lower exploration category – due to the evaluation based on the indirect indicators, the lack of quality tests and non-assessed resources amount.
Prepared by: Wojciech Miśkiewicz, Dariusz Brzeziński, Anna Kalinowska, Joanna Stawierej, Wojciech Szczygielski
* Kozłowska O., Smakowski T., Miśkiewicz W., 2020 – ‘Kruszywo naturalne piaskowo-żwirowe (natural aggregates)’. In: ‘Bilans perspektywicznych zasobów kopalin Polski wg stanu na 31.12.2018 r.’ (eds. Szamałek K., Szuflicki M., Mizerski W.): 258-275. PIG-PIB, Warszawa [in Polish].
2021
General information and occurrence
Two major groups of natural sandy-gravelly aggregates are differentiated: a coarse aggregate group, comprising gravel and sand-gravel mix (sandy-gravelly aggregates), and that of fine aggregates – sandy. Sand deposits in Poland are usually evenly arranged and only southern voivodeships are characterized by their shortage. In turn, the course aggregates deposits – particularly marketable – occur unevenly and especially central voivodeships are characterized by the deficiency.
The bulk of Polish natural sand and gravel deposits are of the Quaternary age. The share of deposits of the older formations: the Pliocene, Miocene and Liassic in the age is subordinate.
The quality of the raw material, and especially deposits homogeneity, depends largely on a genetic type of a given deposit. Among the Quaternary deposits, there are three genetic types differentiated: glacial, fluvioglacial and fluvial (river). They are characterized by a zonality of the occurrence.
In the southern part of Poland, in the Carpathian-Sudetic zone, the most important are deposits of the fluvial (river) origin. In the Sudety Mts., the deposits of sandy-gravelly higher terraces of the Pleistocene age prevail, built mainly of the crystalline rocks and sandstones. In turn, in the Carpathian region the main raw material basis comprises gravelly and sandy-gravelly deposits occurring on flood-plain terraces as well as valley side terraces rising above flood plains. The Carpathian deposits are characterized by a predominance of the material coming from a disintegration of flysch rocks, except for those of the Dunajec River valley, showing a fairly high contribution of the crystalline rocks from the Tatry Mts.
In northern and central Poland – on the Polish Lowlands, the most important are deposits of a glacial (an accumulation platform of front moraine), fluvioglacial (sandrs, eskers) and fluvial (river) origin. Deposits from the northern part of that area are represented by gravelly-sandy accumulations mainly comprising the Scandinavian material – debris of crystalline rocks and limestones with an admixture of quartz and sandstones. In the central and southern parts of this region, the deposits are mainly formed of sandy sediments with a significant contribution of a debris of local rocks.
The deposits of a high quality natural sandy-gravelly aggregates are also located on the Polish maritime area (Baltic Sea). They are of the fluvioglacial processes and the selection of the maritime sediments origin. They are characterized by the isolated form of deposits fields with irregular shape and varying thickness.
According to the Regulation of the Minister of the Environment of the 1st of July 2015 regarding the geological documentation of a raw material deposit, excluding a hydrocarbons field (Journal of Laws 2015, Item 987), establishing i.a. the limit values of the parameters that define the deposit and its boundaries, a feldspar-quartzitic sand deposit with the sand content above 75% should be characterized by the thickness not smaller than 2 m with the ratio of overburden to deposit thickness not higher than 0.3 and the content of mineral silts fraction below 10%; whereas a gravelly, gravelly-sandy and sandy-gravelly deposit with the sand content below 75% should be characterized by the thickness not smaller than 2 m with the ratio of overburden to deposit thickness not higher than 1.0 and the content of mineral silts fraction below 15%.
The sand and gravel deposits occurrence in Poland is presented on the map.
Resources and output
Table 1 shows resources and the current state of exploration and development of natural sand and gravel aggregates.
The anticipated economic resources of natural aggregates as of 31.12.2021 totaled 20,192.23 million tonnes. The resources increased by 231.62 million tonnes (that is by 1.16%) in relation to the previous year. The growth dynamism increased in comparison with the previous year when it was equal 1.09%.
The natural sandy-gravelly aggregates have been documented within four subtypes: sands, sand with gravel, gravel, loamy and silty sands. The resources of sands with the sand content above 75% amount to 9,655.34 million tonnes (increased by 216.33 million tonnes in comparison with 2020) from which 2,737.34 million tonnes are within exploited deposits. The resources of gravelly-sandy and sandy-gravelly aggregates with the sand content between 30% and 75% amount to 9,515.76 million tonnes (the growth by 20.69 million tonnes). The resources of gravel (with the sand content <30%) amount to 983.53 million tonnes (the drop by −5.86 million tonnes) and the resources of silty, loamy sands amounted to 37.61 ;million tonnes (the growth by 0.47 million tonnes).
The resources increased due to:
- The including into “The balance…’ 373 newly documented deposits with the total resources equal above 559.7 million tonnes. In 2021, the largest resources amounting to 102.34 million tonnes (45 new deposits) were documented in Podlaskie Voivodeship. The biggest deposits are as follows: Kuków-Folwark XII (17.92 million tonnes), Racewo – Nowowola (16.26 million tonnes), Kamionka Stara III (15.75 million tonnes) and Starowlany I (8.72 million tonnes). The resources of the 13 biggest deposits amount to almost 88 million tonnes (the range 1.2-17.92 million tonnes) that is 86% of the total resources newly documented in the Voivodeship. The remaining resources of 14.3 million tonnes in the volume (the range 0.05-1.0 million tonnes) are within 32 deposits. In the second best Zachodniopomorskie Voivodeship, there were documented 87 million tonnes of sand and gravel within 12 deposits with the resources from about 350 thousand tonnes to almost 49 million tonnes. The biggest of these deposits are as follows: Sępolno Wielkie 6 (48.91 million tonnes), Stępień IV (13.85 million tonnes). The resources of nine out of all biggest newly documented deposits with resources between 1.3 million tonnes and 49 million tonnes account for 97% of the total newly documented resources. In the third place, in terms of newly documented resources, there is Mazowieckie Voivodeship: 62.99 million tonnes (59 deposits). The biggest newly documented deposits are: Morawy Wielkie VI (10.98 million tonnes), Zbiroża X (7.47 million tonnes), Grzymały IX (3.79 million tonnes), Ruda Szostkowska (3.06 million tonnes). In the 17 biggest deposits with the resources exceeding 1 million tonnes there is more than 49 million tonnes documented. The smallest resources volume, i.e. 3.11 million tonnes, was documented in Świętokrzyskie Voivodeship (three deposits, among them the Mnin II deposit with resources equal 2.9 million tonnes), and in Łódzkie Voivodeship – 7.59 million tonnes (six deposits). In 2021, there were also 4.85 million tonnes of the anticipated sub-economic resources documented. Most of them in the following deposits: Zabełków 1 (2.94 million tonnes) and Mnin II (0.63 million tonnes). The deposits resources approved in 2021 by the Marshalls Voivodeships amounted to 509 million tonnes, by the county mayors amounted to 45 million tonnes and by the Minister of Climate and Environment – to 4.5 million tonnes.
- The verification and updating of resources due to the deposit area enlargement or deepening of its range, the resources updating as a result of a longtime exploitation, the change of a deposit usage and its designation in the site management plans within the borders of which the deposit was documented, or the resources settlement after an allocation of new deposits documented within the area of previously explored. The most significant resources growths coming from new geological documentations (supplements) were recorded for the following deposits: Sarny-Pole IIa – 1 (14.01 million tonnes), Jankowice 2 (12.14 million tonnes) and Rabusiowice (4.29 million tonnes) – all of them located in Małopolskie Voivodeship; Biała (4.68 million tonnes) located in Dolnośląskie Voivodeship; Stryj II (4.67 million tonnes) located in Lubelskie Voivodeship; Bobrowniki-Drahle (4.31 million tonnes) located in Podlaskie Voivodeship. Moreover, the Motkowice deposit in Świętokrzyskie Voivodeship, the Drogoszów II deposit in Opolskie Voivodeship, the Kierzkówka I in Lubelskie Voivodeship, the Jabłonka deposit in Warmińsko-Mazurskie Voivodeship, the Dubeczno I deposit in Lubelskie Voivodeship, the Suchodół V deposit in Mazowieckie Voivodeship, the Jaracz MD in Wielkopolskie Voivodeship enlarged their resources from 2 million tonnes to 3 million tonnes each. In 27 deposits the resources were increased by about 1 million tonnes to 14 million tonnes. In 25 deposits the resources correction did not exceed about 100 thousand tonnes, whereas in 50 deposits the carried out resources settlement did not affect their volumes – they were the results of the exploitation end or the concession extinction.
- The balance of the resources drops and growths, established in the new documentations with recalculated resources (supplements) or being the results of the current resources verification connected with the exploitation – 56.85 million tonnes.
The resources decreased by:
- The output (185.08 million tonnes).
- The crossing 213 aggregate deposits out from the domestic resources balance – about 84.7 million tonnes in total. The biggest resources volumes were crossed out from the i.a. deposits: Jerzmanowice (−14.96 million tonnes), Rokitki (−6.11 million tonnes) and Rokitki III (−5.3 million tonnes) located in Dolnośląskie Voivodeship; Gralewo (−5.16 million tonnes) in Lubuskie Voivodeship; Wręcza-Olszówka II (−3.79 million tonnes) in Mazowieckie Voivodeship; Niwka-Dwudniaki (−3.44 million tonnes) in Małopolskie Voivodeship. In 36 deposits crossed out from ‘The balance..’ there were not any resources left or their amounts were minor (several thousand tonnes), in 100 deposits the remaining resources were equal about 20-200 thousand tonnes, in 52 deposits it was within the range of 200-900 thousand tonnes, whereas in 18 deposits above 1 million tonnes.
- The new documentations with recalculated (decreased) resources (supplements) elaborated for i.a. deposits: Sępólno Wielkie II (−50.18 million tonnes) in Zachodniopomorskie Voivodeship, Sarny Pole IIa – 2 (−14.79 million tonnes) in Opolskie Voivodeship, Węgrzce Wielkie (−10.65 million tonnes) in Małopolskie Voivodeship; Bystrzyca Oławska (−5.58 million tonnes) in Dolnośląskie Voivodeship; Górka Lubartowska (−4.39 million tonnes) in Lubelskie Voivodeship; Zabełków (−3.12 million tonnes) in Śląskie Voivodeship. The drops in 14 deposits covered the resources from about 1 to 5.6 million tonnes, whereas in 35 deposits it was the range between 0.1 and 0.9 million tonnes.
The resources growth in Poland, similarly to the previous years, was the result of the increases of documented resources in most of voivodeships. The most significant increases were recorded in the following Voivodeships: Podlaskie, Mazowieckie, Pomorskie, Lubelskie. The table below shows changes within anticipated economic resources in particular voivodeships in 2021.
|
Increases (thousand tonnes)
|
Decreases (thousand tonnes)
|
||
| Podlaskie Voivodeship | 68,361 | Dolnośląskie Voivodeship | −12,495 |
| Mazowieckie Voivodeship | 45,424 | Małopolskie Voivodeship | −12,222 |
| Pomorskie Voivodeship | 40,585 | Lubuskie Voivodeship | −9,312 |
| Lubelskie Voivodeship | 31,562 | Łódzkie Voivodeship | −9,219 |
| Zachodniopomorskie Voivodeship | 23,995 | Podkarpackie Voivodeship | −5,896 |
| Opolskie Voivodeship | 21,461 | Śląskie Voivodeship | −3,930 |
| Wielkopolskie Voivodeship | 20,399 | Baltic Sea | −1,503 |
| Warmińsko-Mazurskie Voivodeship | 17,878 | ||
| Kujawsko-Pomorskie Voivodeship | 13,419 | ||
| Świętokrzyskie Voivodeship | 3,113 | ||
| Total increases | 286,197 | Total decreases | −54,577 |
In the deposits which were included into current ‘The balance…’ there was mainly sand documented in the volume exceeding 353 million tonnes from which, except for the above mentioned deposits, the biggest deposit is the Sępolno Wielkie 6 (48.91 million tonnes) and Stępień IV (13.85 million tonnes) located in Zachodniopomorskie Voivodeship, Morawy Wielkie VI (10.98 million tonnes) located in Mazowieckie Voivodeship, Słosinko III (16.18 million tonnes) located in Pomorskie Voivodeship. The resources of sand and gravel are equal 200 million tonnes in i.a. deposits: Kobylice IV (21.53 million tonnes) located in Opolskie Voivodeship, Kuków-Folwar XII (17.92 million tonnes), Racewo – Nowowola (16.26 million tonnes) and Kamionka Stara III (15.75 million tonnes) in Podlaskie Voivodeship. New gravel resources amounted to 4.71 million tonnes and the biggest deposits are: Pomianów-Północ (2.05 million tonnes) in Dolnośląskie Voivodeship and Wara-Niwistka 2 (1.26 million tonnes) in Podkarpackie Voivodeship. The average sand content of the newly documented resources is 78%. The Voivodeship distribution of the subtypes resources of the new deposits is presented below:
|
Voivodeship/Region
|
Sand (million tonnes) |
Sand with gravel (million tonnes) |
Gravel (million tonnes) |
Silty, loamy sand (million tonnes) |
| Baltic Sea | 0 | 0 | 0 | 0 |
| Dolnośląskie | 13.0 | 22.3 | 2.0 | 0 |
| Kujawsko-Pomorskie | 24.8 | 0.4 | 0 | 0 |
| Lubelskie | 38.6 | 0 | 0 | 0 |
| Lubuskie | 4.9 | 2.7 | 0 | 0 |
| Łódzkie | 5.2 | 0.4 | 0 | 0 |
| Małopolskie | 0 | 10.8 | 1.3 | 0 |
| Mazowieckie | 53.9 | 9.4 | 0 | 0 |
| Opolskie | 0.6 | 33.3 | 0 | 0 |
| Podkarpackie | 5.7 | 4.4 | 1.3 | 0 |
| Podlaskie | 25.6 | 76.7 | 0 | 0 |
| Pomorskie | 52.2 | 10.5 | 0 | 0 |
| Śląskie | 1.9 | 6.1 | 0 | 0 |
| Świętokrzyskie | 3.1 | 0 | 0 | 0 |
| Warmińsko-Mazurskie | 12.1 | 20.7 | 0 | 0 |
| Wielkopolskie | 26.7 | 2.7 | 0 | 0 |
| Zachodniopomorskie | 85.8 | 0 | 0 | 0.5 |
The total area of the deposits included into ‘The balance…’ in 2021 amounted to 2,990 ha, including 2,685 ha of the deposits with the are above 2 ha and 305 ha of the deposits below 2 ha. The biggest deposits are: Sępolno Wielkie 6 (210 ha) and Stępień IV (74 ha) located in Zachodniopomorskie Voivodeship, Kobylice IV (144 ha) in Opolskie Voivodeship, Grzybowo – Sycowa Huta I (109 ha) in Pomorskie Voivodeship, and Domanice A (89 ha) in Dolnośląskie Voivodeship. Moreover, among the biggest deposits are: Niedźwiedzkie IV, Pojawie Kruszbet, Morawy Wielkie VI, Topola-Północ, Racewo – Nowowola with the area of 51-56 ha each. On the other hand, the smallest newly documented deposit was the Buków I deposit (0.29 ha) in Śląskie Voivodeship. The total area of the deposits covered by new geological documentations with recalculated resources (supplements) decreased by 280 ha, whereas the total area of the deposits crossed out from ‘The balance…’ in 2021 was equal about 1,162 ha.
The biggest numbers of deposits are nowadays documented in the following Voivodeships: Mazowieckie (1,453), Wielkopolskie (1,292), Lubelskie (989), Łódzkie (859), Warmińsko-Mazurskie (850) and Podkarpackie (840).
The voivodeships with the biggest documented resources are: Dolnośląskie (2,308 million tonnes), Małopolskie (1,785 million tonnes), Podlaskie (1,759 million tonnes), Opolskie (1,455 million tonnes), Mazowieckie (1,386 million tonnes) and Podkarpackie (1,328 million tonnes).
The resources of deposits covered by a detailed exploration (A, B and C1 categories) are equal 12,547.27 million tonnes and account for 62.1% of the total resources. The resources covered by the preliminary exploration (C2 and D categories) account for 37.9% of the total resources and amount to 7,644.96 million tonnes. The resources of exploited deposits, being equal 6,148.06 million tonnes (the growth by 15.47 million tonnes in comparison with 2020), account for 30.5% of the total resources. Non-exploited deposits contain 12,236.65 million tonnes (61%) of resources (the growth by 130.5 million tonnes), whereas the resources of abandoned deposits are equal 1,807.53 million tonnes – the growth by 85.65 million tonnes.
The economic resources amounted in 2021 to 4,324.43 million tonnes and increased in comparison with the previous year by 22.68 million tonnes. The economic resources, established for the exploited deposits, are equal 3,626.48million tonnes accounting for 59% of their documented resources. The distribution of the developed resources (anticipated economic, economic and anticipated economic of exploited deposits) in particular voivodeships as of the end of 2021 was as follows:
|
Voivodeship/ Region
|
Developed resources (million tonnes)
|
||
| Anticipated economic | Economic | Anticipated economic of exploited deposits |
|
| Baltic Sea | 84.66 | 83.71 | 46.92 |
| Dolnośląskie | 699.22 | 365.37 | 630.16 |
| Kujawsko-Pomorskie | 174.32 | 120.38 | 119.95 |
| Lubelskie | 154.33 | 77.67 | 134.71 |
| Lubuskie | 331.54 | 166.90 | 239.87 |
| Łódzkie | 348.94 | 208.69 | 276.30 |
| Małopolskie | 433.10 | 132.90 | 328.10 |
| Mazowieckie | 423.85 | 275.68 | 303.01 |
| Opolskie | 280.60 | 121.33 | 255.87 |
| Podkarpackie | 266.26 | 118.59 | 210.12 |
| Podlaskie | 874.60 | 559.98 | 517.35 |
| Pomorskie | 398.91 | 312.54 | 337.37 |
| Śląskie | 262.81 | 81.48 | 208.70 |
| Świętokrzyskie | 90.91 | 40.06 | 83.78 |
| Warmińsko-Mazurskie | 436.31 | 359.98 | 291.03 |
| Wielkopolskie | 501.92 | 307.38 | 360.70 |
| Zachodniopomorskie | 385.80 | 293.84 | 297.78 |
In 2021, the output of sand and gravel amounted to 185.08 million tonnes (it is about 4.8 million tonnes per capita). In comparison with the previous year the exploitation increased by 4.83 million tonnes, that is by 2.6%, in contrast to 2020 when the drop was equal −2.57 million tonnes. The output growth increased in 10 out of 16 voivodeships. In 2021, the demand for the raw materials increased in such industry areas using sandy-gravelly aggregates as: the infrastructure building sector, housing building sector and industrial building sector. Nowadays, the significant part of the aggregates production absorb the large-scale infrastructure investments which stabilize the aggregates market. In perspective of a dozen or so or several dozen years an increasing contribution of aggregates in the production of ready-mix concrete or the production of concrete products in the housing building is expected.
|
The output in comparison with 2020
|
The difference (thousand tonnes) |
The difference (%) |
| Total | 4,833 | 2.7 |
| Warmińsko-Mazurskie Voivodeship | 3,279 | 22.8 |
| Dolnośląskie Voivodeship | 2,312 | 18.1 |
| Wielkopolskie Voivodeship | 1,631 | 16.3 |
| Lubuskie Voivodeship | 1,198 | 20.3 |
| Kujawsko-Pomorskie Voivodeship | 1,185 | 19.4 |
| Pomorskie Voivodeship | 1,134 | 6.4 |
| Zachodniopomorskie Voivodeship | 683 | 6.1 |
| Opolskie Voivodeship | 311 | 4.1 |
| Małopolskie Voivodeship | 196 | 1.6 |
| Świętokrzyskie Voivodeship | 159 | 6.9 |
| Baltic Sea | −193 | −11.4 |
| Lubelskie Voivodeship | −273 | −4.5 |
| Podkarpackie Voivodeship | −469 | −4.7 |
| Mazowieckie Voivodeship | −1,367 | −8.6 |
| Łódzkie Voivodeship | −1,425 | −12.7 |
| Śląskie Voivodeship | −1,666 | −22.0 |
| Podlaskie Voivodeship | −1,861 | −6.7 |
Regarding the division of deposits to the subtypes, the most intensive exploitation was recorded for sand with gravel deposits (the sand content between 30% and 75%) – 95.3 million tonnes (that is more than 50% of the total domestic output), then for sand deposits (the sand content >75%) – 84.3 million tonnes and gravel deposits – 5.1 million tonnes. The detailed division in particular voivodeships is presented below:
|
Voivodeship/Region
|
Sand (million tonnes) |
Sand with gravel (million tonnes) |
Gravel (million tonnes) |
Silty, loamy sand (million tonnes) |
| Baltic Sea | 0 | 1.5 | 0 | 0 |
| Dolnośląskie | 5.1 | 8.9 | 1.1 | 0 |
| Kujawsko-Pomorskie | 6.7 | 0.6 | 0 | 0 |
| Lubelskie | 5.5 | 0.3 | 0 | 0 |
| Lubuskie | 4.0 | 3.1 | 0 | 0 |
| Łódzkie | 8.0 | 1.8 | 0 | 0 |
| Małopolskie | 0.4 | 10.0 | 1.7 | 0 |
| Mazowieckie | 11.3 | 3.3 | 0 | 0 |
| Opolskie | 1.6 | 5.1 | 1.3 | 0 |
| Podkarpackie | 4.4 | 4.2 | 0.7 | 0.2 |
| Podlaskie | 2.8 | 23.0 | 0 | 0 |
| Pomorskie | 10.2 | 8.7 | 0 | 0 |
| Śląskie | 1.2 | 4.4 | 0.3 | 0 |
| Świętokrzyskie | 2.5 | 0 | 0 | 0 |
| Warmińsko-Mazurskie | 2.7 | 15.0 | 0 | 0 |
| Wielkopolskie | 11.0 | 0.7 | 0 | 0 |
| Zachodniopomorskie | 7.0 | 4.8 | 0 | 0.1 |
The number of sand and gravel deposit in 2021 amounted to 10,872 including 2,608 of exploited deposits (in this group there are deposits crossed out from ‘The balance…’ and those for which the concessions expired and the deposits were marked as abandoned). In comparison with the previous year (2,643 deposits) the number has decreased. The number of non-exploited deposits increased by 230 (from 8,029 in 2020 to 8,264 in 2021). The structure of the deposits divided according to the output volume in particular voivodeships in 2021 is presented below:
|
|
Output (thousand tonnes)
|
Exploited deposits
|
|||||
|
<50
|
50-100
|
100-200
|
200-500
|
500-1,000
|
>1,000
|
Number
|
|
| Baltic Sea | 0 | 0 | 0 | 0 | 0 | 1 | 1 |
| Dolnośląskie Voivodeship | 67 | 8 | 18 | 14 | 8 | 0 | 115 |
| Kujawsko-Pomorskie Voivodeship | 106 | 16 | 9 | 5 | 2 | 0 | 138 |
| Lubelskie Voivodeship | 170 | 21 | 7 | 4 | 0 | 0 | 202 |
| Lubuskie Voivodeship | 35 | 3 | 9 | 3 | 5 | 0 | 55 |
| Łódzkie Voivodeship | 204 | 21 | 13 | 8 | 2 | 0 | 248 |
| Małopolskie Voivodeship | 42 | 12 | 8 | 19 | 5 | 0 | 86 |
| Mazowieckie Voivodeship | 333 | 32 | 21 | 8 | 3 | 0 | 397 |
| Opolskie Voivodeship | 19 | 8 | 5 | 7 | 5 | 1 | 45 |
| Podkarpackie Voivodeship | 141 | 16 | 19 | 14 | 0 | 0 | 190 |
| Podlaskie Voivodeship | 202 | 18 | 18 | 12 | 3 | 8 | 261 |
| Pomorskie Voivodeship | 101 | 15 | 26 | 16 | 4 | 2 | 164 |
| Śląskie Voivodeship | 22 | 8 | 9 | 7 | 2 | 0 | 48 |
| Świętokrzyskie Voivodeship | 46 | 1 | 5 | 1 | 1 | 0 | 54 |
| Warmińsko-Mazurskie Voivodeship | 137 | 18 | 11 | 11 | 6 | 2 | 185 |
| Wielkopolskie Voivodeship | 294 | 31 | 15 | 10 | 0 | 0 | 350 |
| Zachodniopomorskie Voivodeship | 34 | 10 | 8 | 11 | 3 | 3 | 69 |
| Razem | 1,953 | 238 | 201 | 150 | 49 | 17 | 2,608 |
The companies producing natural aggregates on Polish market are operating in various types of business activity. They carry on the exploitation in single or couple of plants, in the case of the biggest companies even in dozen or so. They are also associated in producers’ groups. In 2021, almost 1,400 companies (the most numerous in 2021) exploited up to 50 thousand tonnes of the raw material. Their total contribution in the domestic output was 11% (more than 21 million tonnes). The biggest contribution – about 72 million tonnes – that is almost 38% in the total domestic output, had the group of 18 concession holders. Every single one from this group exploited at least 1 million tonnes, whereas the largest companies more than 4-5 million tonnes of the sandy-gravelly aggregates. The distribution in particular output scopes is as follows:
|
|
Output
|
||||
|
<50
|
50-200
|
200-500
|
500-1,000
|
>1,000
|
|
| Output (thousand tonnes) | 21,280 | 24,774 | 31,075 | 37,948 | 69,999 |
| Contribution in output (%) | 11 | 13 | 17 | 21 | 38 |
Natural sand and gravel are also obtained during the exploitation of brown coal deposits. In 2021, the output of the raw material from non-documented deposits during the exploitation in the Bełchatów mine from the Szczerców field amounted to 281.47 thousand tonnes of sand and sand with gravel.
Figure below shows changes in domestic resources and production of sand and gravel in Poland in the years 1989-2021.
The prognostic resources of the natural sandy-gravelly aggregates are assessed to be equal more than 13 billion tonnes*. The occur quite evenly in Poland. The areas of the prospective raw material occurrences, in contrast to the prognostic ones, are of a lower exploration category – due to the evaluation based on the indirect indicators, the lack of quality tests and non-assessed resources amount.
Prepared by: Dariusz Brzeziński, Anna Kalinowska, Wojciech Miśkiewicz, Joanna Stawierej, Wojciech Szczygielski
* Kozłowska O., Smakowski T., Miśkiewicz W., 2020 – ‘Kruszywo naturalne piaskowo-żwirowe (natural aggregates)’. In: ‘Bilans perspektywicznych zasobów kopalin Polski wg stanu na 31.12.2018 r.’ (eds. Szamałek K., Szuflicki M., Mizerski W.): 258-275. PIG-PIB, Warszawa [in Polish].
2020
General information and occurrence
Two major groups of natural sandy-gravelly aggregates are differentiated: a coarse aggregate group, comprising gravels and sand-gravel mix (sandy-gravelly aggregates), and that of fine aggregates – sandy. Sand deposits in Poland are usually evenly arranged and only southern Voivodeships are characterized by their shortage (map). In turn, the course aggregates deposits – particularly marketable – occur unevenly and especially the central Voivodeships are characterized by the deficiency.
The bulk of Polish natural sand and gravel deposits are of the Quaternary age. The share of deposits of the older formations: the Pliocene, Miocene and Liassic in the age is subordinate.
The quality of a raw material, and especially the deposits homogeneity, depends largely on a genetic type of a given deposit. Among the deposits of the Quaternary age there are three genetic types: glacial, fluvioglacial and fluvial (river). They are characterized by a zonality of the occurrence.
In the southern part of Poland, in the Carpathian-Sudetic zone, the most important are deposits of the fluvial (river) origin. In the Sudety Mts., the deposits of sandy-gravelly higher terraces of the Pleistocene age prevail, built mainly of the crystalline rocks and sandstones. In turn, in the Carpathian region the raw material basis comprises mainly gravelly and sandy-gravelly deposits occurring on flood-plain terraces as well as valley side terraces rising above flood plains. The Carpathian deposits are characterized by a predominance of the material coming from a disintegration of flysch rocks, except for those of the Dunajec River valley, showing a fairly high contribution of the crystalline rocks from the Tatry Mts.
In northern and central Poland – on the Polish Lowlands, the most important are deposits of a glacial (an accumulation platform of front moraine) and fluvioglacial (outwash plain and esker) origin and resulting from a river accumulation. Deposits from the northern part of that area are represented by gravelly-sandy accumulations mainly comprising the Scandinavian material – debris of crystalline rocks and limestones with an admixture of quartz and sandstones. In the central and southern parts of this region, the deposits are mainly formed of sandy sediments with a significant share of a debris of local rocks.
The deposits of a high quality natural sandy-gravelly aggregates are also located on the Polish economic zone of the Baltic Sea. They are of a fluvioglacial processes and the selection of the maritime sediments origin. They are characterized by the isolated form of deposits fields with irregular shape and varying thickness.
According to the Regulation of the Minister of the Environment of the 1st of July 2015 regarding the geological documentation of a raw material deposit, excluding a hydrocarbons field , establishing the limit values of the parameters that define the deposit and its borders, a feldspar-quartzitic sand deposit with the sand content above 75% should be characterized by the thickness not smaller than 2 m, the ratio of cover to deposit series not higher than 0.3 and the content of silt fraction below 10%, while a sand, gravelly-sandy and sandy-gravelly deposit with the sand content below 75% should be characterized by the thickness not smaller than 2 m, with the ratio of cover to deposit series not higher than 1.0 and the content of a silt fraction below 15%.
The sand and gravel deposits occurrence in Poland is presented on the map.
Resources and output
Table 1 shows resources and the current state of exploration and development of natural sand and gravel aggregates.
The anticipated economic resources of natural aggregates as of 31.12.2020 totaled 19,960.61 million tonnes. The resources increased by 217.95 million tonnes (that is by 1.09%) in relation to the previous year. The growth dynamism decreased in comparison with the previous year when it was equal 1.4%.
The natural sandy-gravelly aggregates have been documented within 4 subtypes: sands, sands with gravel, gravel, loamy and silty sands. The resources of sands with the sand content above 75% amount to 9,439.01 million tonnes (increased by 469.37 million tonnes in comparison with 2019) from which 2,718.50 million tonnes are within exploited deposits. The resources of gravelly-sandy and sandy-gravelly aggregates with the sand content between 30% and 75% amount to 9,495.07million tonnes (the drop by −251.71 million tonnes). The resources of gravel (with the sand content <30%) amount to 989.39 million tonnes (the drop by −4.85 million tonnes) and the resources of silty, loamy sands amounted 37.14 million tonnes (the growth by 5.15 million tonnes).
The resources increased due to:
- The including into ‘The balance…’ 347 newly documented deposits with the total resources equal above 429.22 million tonnes. In 2020, the largest resources amount: 93.13 million tonnes (37 new deposits) was documented in Pomorskie Voivodeship. The biggest deposits are as follows: Nowy Barkoczyn VII (18.62 million tonnes), Lubiana-Owśnica III (11.65 million tonnes), Linia V (11.47 million tonnes), Gostomie XIX (10.50 million tonnes), Lędziechowo II (6.1 million tonnes), Gostomie XVII (6.02 million tonnes), Łęczyce (5.81 million tonnes), Łebień 2 (4.08 million tonnes. The resources of the 12 biggest deposits amount to almost 82 million tonnes the range 1.3-18.6 million tonnes) that is 88% of the total resources newly documented in the Voivodeship. The remaining resources of 11.2 million tonnes in the volume (the range 0.03-0.9 million tonnes) are within 25 deposits. In the second best Wielkopolskie Voivodeship, there were documented about 44.57 million tonnes of sands and gravel within 55 deposits with the resources from about 48 thousand tonnes to almost 14 million tonnes. The biggest of these deposits are as follows: Łężeczki MŁ (13.82 million tonnes), Luciny IV (4.89 million tonnes) and Janków, Murzynowo Leśne I, Stary Gostyń JJ, Łękno I, Rosko MŁ V, Romanowo Górne DW II, Biskupice Ołoboczne V, Gulcz BW – with resources between 1.1 million tonnes and 1.8 million tonnes. The resources of 10 out of all of newly documented deposits are equal 30 million tonnes. In third place, in terms of newly documented resources, there is Opolskie Voivodeship: 42.06 million tonnes (9 deposits). The biggest new deposits are: Bielice – Zbiornik 1 (25.09 million tonnes), Borki Małe (3.89 million tonnes), Więcmierzyce 1 (3.56 million tonnes), Jaśkowice (3.24 million tonnes). The smallest resources amount i.e. 4.29 million tonnes (in 3 deposits) was documented in Świętokrzyskie Voivodeship, moreover there were 7 million tonnes (in 15 deposits) documented in Kujawsko-Pomorskie Voivodeship, 7.16 million tonnes (in 10 deposits) documented in Małopolskie Voivodeship. In 2020, there were also 4.16 million tonnes of the anticipated sub-economic resources documented. Most of them in: Mrowla III deposit (0.94 million tonnes) located in Podkarpackie Voivodeship, Maurzyce II (0.84 million tonnes) located in Łódzkie Voivodeship, Miasteczko I (0.59 million tonnes) located in Śląskie Voivodeship, Strzyże II (0.33 million tonnes) located in Mazowieckie Voivodeship, Marszowice-Piaski (0.3 million tonnes) located in Małopolskie Voivodeship.
- The verification and updating of resources due to the deposit area enlargement or deepening of its range, the resources updating as a result of a longtime exploitation, the change of a deposit usage and its designation in the site management plans within the borders of which the deposit was documented, or the resources settlement after an allocation of new deposits documented within the area of previously explored. The most significant resources growths were recorded for the following deposits: Kazimierz Lisia Jama (21.44 million tonnes), Ognica (6.88 million tonnes), Sępólno Wielkie 5 (in previous years Sępólno Wielkie V) (6.53 million tonnes) and Włościbórz (3.14 million tonnes) – all of them located in Zachodniopomorskie Voivodeship; Pogorzelice II (7.13 million tonnes) in Pomorskie Voivodeship; Skoki II – Dąb Mały (15.71 million tonnes) in Kujawsko-Pomorskie Voivodeship; Ziemin I (3.1 million tonnes) in Wielkopolskie Voivodeship; Bieńkowice – Zachód 1 (5.20 million tonnes) in Śląskie Voivodeship; Lipiny (5.05 million tonnes) and Medynia Łańcucka-Czarna (3.21 million tonnes) in Podkarpackie Voivodeship, Dwory (5.15 million tonnes) in Małopolskie Voivodeship, Nowy Jaworów I (4.1 million tonnes) in Dolnośląskie Voivodeship. In 30 deposits the resources increased from about 1 million tonnes to 21 million tonnes. In 36 deposits the resources adjustment did not exceed about 100 thousand tonnes, whereas in 42 deposits the resources settlement did not affect their volumes – they were the results of the exploitation end or the concession extinction.
- The balance of the resources drops and growths, established in the new documentations with recalculated resources or being the results of the current resources verification connected with the exploitation (almost 27 million tonnes, including more than 8 million tonnes of exploitation losses).
The resources decreased by:
- The output (180.24 million tonnes).
- The crossing 173 aggregate deposits out from the domestic resources balance – about 57.9 million tonnes in total. The biggest resources volumes were crossed out from the i.a. deposits: Ostromice III (−1.01 million tonnes) located in Zachodniopomorskie Voivodeship; Botowo III (−1.51 million tonnes) in Warmińsko-Mazurskie Voivodeship; Łękawica (−2.34 million tonnes) in Śląskie Voivodeship, Rokitki II (−1.52 million tonnes) in Pomorskie Voivodeship, Łękowo (−1.12 million tonnes) in Podlaskie Voivodeship, Zapałów II (−5.71 million tonnes) in Podkarpackie Voivodeship, Zbiroża VIII (−2.70 million tonnes) and Zbiroża V (−1.74 million tonnes) in Mazowieckie Voivodeship, Szujec (−7.54 million tonnes) in Małopolskie Voivodeship, Sikorowo III (−1.58 million tonnes), Radziki IV (−1.31 million tonnes) and Smolniki I (−1.05 million tonnes) in Kujawsko-Pomorskie Voivodeship, Zubrza (−1.784 million tonnes) in Dolnośląskie Voivodeship. In 26 deposits crossed out from ‘The balance…’ there were not any resources left or their amounts were minor (a dozen or so thousand tonnes), in 80 deposits the resources volumes varied between 20 and 200 thousand tonnes, in 40 deposits the range was 200-900 thousand tonnes, whereas in 13 deposits above 1 million tonnes.
- The new documentation with recalculated (decreased) resources elaborated for i.a. deposits: Deszczno-Łagodzin p. Krasowiec (−2 million tonnes) and Grajówka-Zbiornik-Pole Północne (−3.32 million tonnes) in Lubuskie Voivodeship, Woliczno SW (−10.77 million tonnes) and Łubowo (−2.06 million tonnes) in Zachodniopomorskie Voivodeship, Legnica-pole Wschodnie (−2.45 million tonnes) in Dolnośląskie Voivodeship, Nowy Barkoczyn IV (−13.73 million tonnes), Ostrowite (−4 million tonnes) and Mirowo XV (−2.77 million tonnes) in Pomorskie Voivodeship, Bielice – Zbiornik (−17.1 million tonnes) and Więcmierzyce (−3.37 million tonnes) in Opolskie Voivodeship, Zabawa (−5.44 million tonnes) in Małopolskie Voivodeship. The drops in 14 deposits covered the resources from about 1 to 17 million tonnes, whereas in 46 deposits it was the range between 0.1 and 0.7 million tonnes.
The resources growth in Poland, similarly to the previous years, was the result of the increases in most of Voivodeships. The most significant increases were recorded in the following: Pomorskie, Zachodniopomorskie, Wielkopolskie, Podkarpackie, Dolnośląskie, Lubuskie. The table below shows changes within anticipated economic resources in particular Voivodeships in 2020.
|
Increases (thousand tonnes)
|
Decreases (thousand tonnes)
|
||
| Pomorskie Voivodeship | 68,534 | Małopolskie Voivodeship | −15,556 |
| Zachodniopomorskie Voivodeship | 46,050 | Baltic Sea | −3,624 |
| Wielkopolskie Voivodeship | 34,284 | Podlaskie Voivodeship | −1,367 |
| Podkarpackie Voivodeship | 14,924 | ||
| Dolnośląskie Voivodeship | 11,500 | ||
| Lubuskie Voivodeship | 11,150 | ||
| Opolskie Voivodeship | 10,712 | ||
| Kujawsko-Pomorskie Voivodeship | 10,526 | ||
| Lubelskie Voivodeship | 9,903 | ||
| Śląskie Voivodeship | 9,805 | ||
| Warmińsko-Mazurskie Voivodeship | 4,868 | ||
| Mazowieckie Voivodeship | 4,862 | ||
| Świętokrzyskie Voivodeship | 1,037 | ||
| Łódzkie Voivodeship | 345 | ||
| Total increases | 238,501 | Total decreases | −20,547 |
In the deposits which were included into ‘The balance…’ there was mainly sand documented (325 million tonnes) – and the biggest one, except for the above mentione is Wierzchowo I (12.5 million tonnes) in Zachodniopomorskie Voivodeship. The resources of sand with gravel are equal 98 million tonnes within 70 deposits, i.e. Bielice – Zbiornik 1 (25.09 million tonnes) in Opolskie Voivodeship, Łukawiec – 2 (6.33 million tonnes) in Podkarpackie Voivodeship, Drahle XI (6.32 million tonnes) in Podlaskie Voivodeship, Nowy Barkoczyn VII (6.02 million tonnes) in Pomorskie Voivodeship, Grajówka – Zbiornik – Pole Północne 1 (4.56 million tonnes) in Lubuskie Voivodeship. The new gravel resources amount to 5.2 million tonnes within 6 deposits, from which the biggest is Dębno-Dunajec (2.16 million tonnes) in Małopolskie Voivodeship, Sierakośce-IV (1.69 million tonnes) in Podkarpackie Voivodeship and Sędzisław IV (0.66 million tonnes) in Dolnośląskie Voivodeship. The Voivodeship distribution of the subtype resources of the new deposits is presented below:
|
Voivodeship
|
Sand (million tonnes) |
Sand with gravel (million tonnes) |
Gravel (million tonnes) |
Silty, loamy sand (million tonnes) |
| Dolnośląskie | 21.2 | 3.2 | 0.7 | 0 |
| Kujawsko-Pomorskie | 6.2 | 0.8 | 0 | 0 |
| Lubelskie | 16.6 | 0.3 | 0 | 0 |
| Lubuskie | 18.1 | 4.6 | 0 | 0 |
| Łódzkie | 17.9 | 0 | 0 | 0 |
| Małopolskie | 1.6 | 3.3 | 2.3 | 0 |
| Mazowieckie | 22.8 | 1.4 | 0 | 0 |
| Opolskie | 10.6 | 31.5 | 0 | 0 |
| Podkarpackie | 8.4 | 7.6 | 2.2 | 0 |
| Podlaskie | 18.1 | 9.9 | 0 | 0 |
| Pomorskie | 85.2 | 7.8 | 0 | 0.2 |
| Śląskie | 14.6 | 7.8 | 0 | 0 |
| Świętokrzyskie | 4.3 | 0 | 0 | 0 |
| Warmińsko-Mazurskie | 10.5 | 12.6 | 0 | 0 |
| Wielkopolskie | 41.7 | 2.8 | 0 | 0 |
| Zachodniopomorskie | 27.0 | 4.9 | 0 | 0.9 |
The total area of the deposits included into ‘The balance…’ in 2020 amounted to 2,378 ha, including 2,110 ha of the deposits with the are above 2 ha and 268 ha of the deposits below 2 ha. The biggest deposits are: Bielice – Zbiornik (141 ha) in Opolskie Voivodeship, Nowy Barkoczyn VII (104 ha) in Pomorskie Voivodeship, Łagiewniki Wielkie I (56 ha) in Śląskie Voivodeship, Łężeczki MŁ (52 ha) in Wielkopolskie Voivodeship, Łubowo I (41 ha) in Zachodniopomorskie Voivodeship. On the other hand, the smallest newly documented deposit is Gostomie XVIII (0.14 ha) in Pomorskie Voivodeship. The total area of the newly documented deposits is as follows:
|
Voivodeship
|
The area of newly documented deposits (ha)
|
||
| Total | >2 ha | ≤2 ha | |
| Pomorskie | 406 | 375 | 31 |
| Wielkopolskie | 280 | 236 | 44 |
| Opolskie | 248 | 248 | 0 |
| Zachodniopomorskie | 163 | 156 | 7 |
| Śląskie | 161 | 159 | 2 |
| Podlaskie | 152 | 117 | 35 |
| Podkarpackie | 141 | 119 | 22 |
| Lubuskie | 137 | 137 | 0 |
| Dolnośląskie | 134 | 127 | 7 |
| Mazowieckie | 122 | 91 | 31 |
| Warmińsko-mazurskie | 108 | 89 | 19 |
| Lubelskie | 97 | 78 | 19 |
| Łódzkie | 80 | 53 | 27 |
| Małopolskie | 70 | 65 | 5 |
| Kujawsko-pomorskie | 53 | 39 | 14 |
| Świętokrzyskie | 25 | 22 | 3 |
The biggest numbers of deposits are nowadays documented in the following Voivodeships: Mazowieckie (1,421), Wielkopolskie (1,267), Lubelskie (981), Łódzkie (863), Warmińsko-Mazurskie (836) and Podkarpackie (769).
The Voivodeships with the biggest documented resources are: Dolnośląskie (2,320 million tonnes), Małopolskie (1,797 million tonnes), Podlaskie (1,690 million tonnes), Opolskie (1,433 million tonnes), Mazowieckie (1,340 million tonnes) and Podkarpackie (1,334 million tonnes).
The resources of deposits covered by a detailed exploration (A, B and C1 categories) are equal 12,207.76 million tonnes and account for 61% of the total resources. The resources covered by the preliminary exploration (C2 and D categories) account for 38.8% of the total resources and amount to 7,752.85 million tonnes. The resources of exploited deposits, being equal 6,132.59 million tonnes, account for 31% of the total resources. These resources increased by 170.76 million tonnes in comparison with 2019. Non-exploited deposits contain 12,106.15 million tonnes (61%) of resources (the growth by 29.72 million tonnes), whereas resources of abandoned deposits are equal 1,721.88 million tonnes. The latter resources increased by 17.49 million tonnes.
The economic resources amounted in 2020 to 4,301.75 million tonnes and increased in comparison with the previous year by 132.93 million tonnes. The economic resources, established for the exploited deposits, are equal 3,626.75 million tonnes accounting for 59% of their documented resources. The distribution of the developed anticipated economic resources, the economic resources and exploited deposits in particular Voivodeships as of the end of 2020 was as follows:
|
Voivodeship/ Region
|
Developed resources
(million tonnes) |
||
| Anticipated economic | Economic | Anticipated economic of exploited deposits | |
| Baltic Sea | 86.16 | 85.21 | 48.43 |
| Dolnośląskie Voivodeship | 707.74 | 374.67 | 581.82 |
| Kujawsko-Pomorskie Voivodeship | 167.16 | 114.43 | 118.65 |
| Lubelskie Voivodeship | 149.50 | 77.04 | 131.28 |
| Lubuskie Voivodeship | 346.61 | 182.86 | 311.11 |
| Łódzkie Voivodeship | 351.44 | 208.63 | 229.41 |
| Małopolskie Voivodeship | 439.46 | 144.05 | 318.87 |
| Mazowieckie Voivodeship | 420.29 | 273.09 | 295.13 |
| Opolskie Voivodeship | 310.47 | 132.92 | 248.10 |
| Podkarpackie Voivodeship | 263.89 | 119.12 | 198.33 |
| Podlaskie Voivodeship | 845.91 | 548.22 | 493.95 |
| Pomorskie Voivodeship | 396.93 | 309.04 | 329.75 |
| Śląskie Voivodeship | 272.54 | 87.28 | 173.51 |
| Świętokrzyskie Voivodeship | 91.19 | 42.91 | 85.73 |
| Warmińsko-Mazurskie Voivodeship | 433.84 | 355.41 | 308.68 |
| Wielkopolskie Voivodeship | 486.00 | 295.45 | 336.13 |
| Zachodniopomorskie Voivodeship | 363.47 | 276.44 | 242.60 |
In 2020, the output of sands and gravel amounted to 180.24 million tonnes. In comparison with the previous year it dropped by −2.57 million tonnes that is by 1.4%. The drop was significantly lower than in 2019 (7.2%). The exploitation decreased in 10 out of 16 Voivodeships. The demand for the raw materials dropped in every industry areas using sand and gravel: the infrastructure building sector, housing building sector and industrial building sector. The economic situation got worse i.e: the construction and assembly production drop, the reduction of the public auctions for the building works was recorded and there was of course the situation with COVID which affected the market. The biggest output drops were recorded in the following Voivodeship: Wielkopolskie, Małopolskie, Śląskie, Zachodniopomorskie, Opolskie, Warminsko-Mazurskie and Dolnośląskie. The output changes in 2020 in particular Voivodeships in 2020 is presented below:
|
The output in comparison with 2019
|
The difference (thousand tonnes) |
The difference (%) |
| Total | −2,570 | −1.4 |
| Łódzkie Voivodeship | 2,064 | 22.5 |
| Podlaskie Voivodeship | 1,931 | 7.5 |
| Lubuskie Voivodeship | 1,181 | 25.0 |
| Mazowieckie Voivodeship | 1,118 | 7.5 |
| Podkarpackie Voivodeship | 603 | 6.5 |
| Pomorskie Voivodeship | 540 | 3.1 |
| Baltic Sea | 420 | 33.0 |
| Świętokrzyskie Voivodeship | −269 | −10.5 |
| Kujawsko-Pomorskie Voivodeship | −276 | −4.3 |
| Lubelskie Voivodeship | −361 | −5.6 |
| Dolnośląskie Voivodeship | −1,086 | −7.8 |
| Warmińsko-Mazurskie Voivodeship | −1,183 | −7.6 |
| Opolskie Voivodeship | −1,193 | −13.5 |
| Zachodniopomorskie Voivodeship | −1,301 | −10.4 |
| Śląskie Voivodeship | −1,376 | −15.4 |
| Małopolskie Voivodeship | −1,412 | −10.6 |
| Wielkopolskie Voivodeship | −1,969 | −16.4 |
The number of sands and gravel deposit in 2020 amounted to 10,672 including 2,643 of exploited deposits (in this group there are deposits crossed out from ‘The balance…’ and those for which the concessions expired and the deposits were marked as abandoned). In comparison with the previous year (2,626 deposits) the number has increased. The number of non-exploited deposits increased by 150 (from 7,878 in 2019 to 8,029 in 2020). The structure of the deposits divided according to the output volume in particular Voivodeships in 2020 is presented below:
|
Voivodeship/Region
|
Output (thousand tonnes)
|
Exploited deposits
|
|||||
|
<50
|
50-200
|
200-500
|
500-1,000
|
>1,000
|
number
|
(%)
|
|
| Baltic Sea | 0 | 0 | 0 | 0 | 1 | 1 | 33 |
| Dolnośląskie Voivodeship | 67 | 28 | 14 | 6 | 0 | 115 | 24 |
| Kujawsko-Pomorskie Voivodeship | 111 | 26 | 4 | 1 | 0 | 142 | 20 |
| Lubelskie Voivodeship | 185 | 23 | 3 | 1 | 0 | 212 | 22 |
| Lubuskie Voivodeship | 42 | 14 | 5 | 3 | 0 | 64 | 23 |
| Łódzkie Voivodeship | 189 | 31 | 12 | 0 | 1 | 233 | 27 |
| Małopolskie Voivodeship | 41 | 24 | 17 | 5 | 0 | 87 | 23 |
| Mazowieckie Voivodeship | 330 | 47 | 7 | 5 | 1 | 390 | 27 |
| Opolskie Voivodeship | 22 | 8 | 7 | 7 | 0 | 44 | 22 |
| Podkarpackie Voivodeship | 136 | 43 | 9 | 1 | 0 | 189 | 25 |
| Podlaskie Voivodeship | 197 | 37 | 12 | 6 | 7 | 259 | 32 |
| Pomorskie Voivodeship | 102 | 48 | 14 | 2 | 2 | 168 | 22 |
| Śląskie Voivodeship | 27 | 10 | 8 | 5 | 0 | 50 | 17 |
| Świętokrzyskie Voivodeship | 52 | 8 | 1 | 0 | 0 | 61 | 30 |
| Warmińsko-Mazurskie Voivodeship | 143 | 30 | 10 | 5 | 2 | 190 | 23 |
| Wielkopolskie Voivodeship | 327 | 40 | 4 | 0 | 0 | 371 | 29 |
| Zachodniopomorskie Voivodeship | 35 | 18 | 9 | 3 | 2 | 67 | 17 |
| Total | 2,006 | 435 | 136 | 50 | 16 | 2,643 | |
The companies producing natural aggregates on Polish market are operating solely or are associated in groups. The carry on the exploitation in single or couple of plants, in the case of the biggest companies even in dozen or so. More than 1,300 companies (the most numerous in 2020) exploited below 50 thousand tonnes of the raw material. Their total contribution in the domestic output was 11% (about 20 million tonnes). The biggest contribution (about 72 million tonnes), that is almost 40% in the total domestic, had the group of 20 concession holders. Every single one from this group exploited at least 1 million tonnes, whereas the largest companies more than 5 million tonnes of the sandy-gravelly aggregates. The distribution in particular output scopes is as follows:
|
|
Output
|
||||
|
<50
|
50-200
|
200-500
|
500-1,000
|
>1,000
|
|
| Output (thousand tonnes) | 20,088 | 38,146 | 28,572 | 21,821 | 71,613 |
| Contribution in output (%) | 11 | 21 | 16 | 12 | 40 |
Natural sands and gravel are also recovered during the exploitation of brown coal deposits. In 2020 the output of the raw material from non-documented deposits during the exploitation in the Bełchatów mine from the Szczerców field amounted to 275.89 thousand tonnes, whereas the output in Turów was equal 9.5 thousand tonnes of sands and sands with gravel.
Figure below shows changes in domestic resources and production of sand and gravel in Poland in the years 1989-2020.
The prognostic resources of the natural sandy-gravelly aggregates are assessed to be equal more than 13 billion tonnes*. The occur quite evenly in Poland. The areas of the prospective raw material occurrences, in contrast to the prognostic ones, are of a lower exploration category – due to the evaluation based on the indirect indicators, the lack of quality tests and non-assessed resources amount.
Prepared by: Dariusz Brzeziński, Anna Kalinowska, Wojciech Miśkiewicz, Joanna Stawierej
* Kozłowska O., Smakowski T., Miśkiewicz W., 2020 – ‘Kruszywo naturalne piaskowo-żwirowe (natural aggregates)’. In: ‘Bilans perspektywicznych zasobów kopalin Polski wg stanu na 31.12.2018 r.’ (eds. Szamałek K., Szuflicki M., Mizerski W.): 258-275. PIG-PIB, Warszawa [in Polish].
2019
General information and occurrence
Two major groups of natural sandy-gravelly aggregates are differentiated: a coarse aggregate group, comprising gravels and sand-gravel mix (sandy-gravelly aggregates), and that of fine aggregates – sandy. Sand deposits in Poland are usually evenly arranged and only southern Voivodeships are characterized by their shortage (map). In turn, the course aggregates deposits – particularly marketable – occur unevenly and especially the central Voivodeships are characterized by the deficiency.
The bulk of Polish natural sand and gravel deposits are of the Quaternary age. The share of deposits of the older formations: the Pliocene, Miocene and Liassic in the age is subordinate.
The quality of a raw material, and especially the deposits homogeneity, depends largely on a genetic type of a given deposit. Among the deposits of the Quaternary age there are three genetic types: glacial, fluvioglacial and fluvial (river). They are characterized by a zonality of the occurrence.
In the southern part of Poland, in the Carpathian-Sudetic zone, the most common are deposits of the fluvial (river) origin. In the Sudety Mts., the deposits of sandy-gravel higher terraces of the Pleistocene age prevail, built mainly of the crystalline rocks and sandstones. In turn, in the Carpathian region the raw material basis comprises mainly gravelly and sandy-gravelly deposits occurring on flood-plain terraces as well as valley side terraces rising above flood plains. The Carpathian deposits are characterized by a predominance of the material coming from a disintegration of flysch rocks, except for those of the Dunajec River valley, showing a fairly high contribution of the crystalline rocks from the Tatry Mts.
In northern and central Poland – on the Polish Lowlands, the most important are deposits of a glacial (an accumulation platform of front moraine) and fluvioglacial (outwash plain and esker) origin and resulting from a river accumulation. Deposits from the northern part of that area are represented by gravelly-sandy accumulations mainly comprising the Scandinavian material – debris of crystalline rocks and limestones with an admixture of quartz and sandstones. In the central and southern parts of this region, the deposits are mainly formed of sandy sediments with a significant share of a debris of local rocks.
The deposits of a high quality natural sandy-gravelly aggregates are also located on the Polish economic zone of the Baltic Sea.
According to the Regulation of the Minister of the Environment of the 1st of July 2015 regarding the geological documentation of a raw material deposit, excluding a hydrocarbons field , establishing the limit values of the parameters that define the deposit and its borders, a feldspar-quartzitic sand deposit with the sand content above 75% should be characterized by the thickness not smaller than 2 m, the ratio of cover to deposit series not higher than 0.3 and the content of silt fraction below 10%, while a sand, gravelly-sandy and sandy-gravelly deposit with the sand content below 75% should be characterized by the thickness not smaller than 2 m, with the ratio of cover to deposit series not higher than 1.0 and the content of a silt fraction below 15%.
The sand and gravel deposits occurrence in Poland is presented on the map.
Resources and output
Table 1 shows resources and the current state of exploration and development of natural sand and gravel aggregates.
The anticipated economic resources of natural aggregates as of 31.12.2019 totaled 19,742.66 million tonnes. The resources increased by 272.28 million tonnes (that is by 1.4%) in relation to the previous year. The growth dynamism increased in comparison with the previous year when it was equal 1.13%.
The natural sandy-gravelly aggregates have being documented within 4 subtypes: sands, sands with gravel, gravel, loamy and silty sands. The resources of sands with the sand content above 75% amount to 8,969.64 million tonnes (increased by 254.56 million tonnes in comparison with 2018) from which 2,535.63 million tonnes are within exploited deposits. The resources of gravelly-sandy and sandy-gravelly aggregates with the sand content between 30% and 75% amount to 9,746.78 million tonnes (the growth by 17.87 million tonnes). The resources of gravel (with the sand content <30%) amount to 994.24 million tonnes (the drop by 2.58 million tonnes) and the resources of silty, loamy sands amounted to 31.99 million tonnes (the growth by 2.43 million tonnes).
In particular Voivodeship the distribution of the anticipated economic resources of natural aggregates subtypes as of the end of 2019 was as follows:
|
Voivodeship/ Region
|
Sand (million tonnes) |
Sand with gravel (million tonnes) |
Gravel (million tonnes) |
Silty, loamy sand (million tonnes) |
| Baltic Sea | 0 | 135 | 0 | 0 |
| Dolnośląskie | 554 | 1,597 | 144 | 14 |
| Kujawsko-Pomorskie | 394 | 45 | 0 | 0 |
| Lubelskie | 1,004 | 20 | 0 | 0 |
| Lubuskie | 615 | 561 | 0 | 0 |
| Łódzkie | 582 | 146 | 0 | 0 |
| Małopolskie | 92 | 1,176 | 545 | 0 |
| Mazowieckie | 1,058 | 277 | 0 | 0 |
| Opolskie | 200 | 1,072 | 150 | 1 |
| Podkarpackie | 684 | 547 | 83 | 5 |
| Podlaskie | 150 | 1,541 | 0 | 0 |
| Pomorskie | 693 | 487 | 0 | 2 |
| Śląskie | 370 | 453 | 67 | 0 |
| Świętokrzyskie | 620 | 21 | 2 | 3 |
| Warmińsko-Mazurskie | 319 | 981 | 2 | 0 |
| Wielkopolskie | 920 | 167 | 0 | 0 |
| Zachodniopomorskie | 716 | 519 | 0 | 6 |
The resources increased due to:
- The including into ‘The balance…’ 408 newly documented deposits with the total resources equal above 438 million tonnes. In 2019, the largest resources amount: 71.82 million tonnes (31 new deposits) was documented in Pomorskie Voivodeship. The biggest deposits are as follows: Strzelęcino III (15.5 million tonnes), Sycowa Huta (12.08 million tonnes), Rychnowy III (9.43 million tonnes), Zagórki IV (6.54 million tonnes), Kleszczewo I (4.78 million tonnes), Sulęczyno V (3.83 million tonnes). The resources of the 12 biggest deposits amount to above 63 million tonnes that is 88% of the total resources documented in the Voivodeship. The remaining resources of 8.7 million tonnes in the volume (the range 0.12-1 million tonnes) are within 19 deposits. In the second best Podlaskie Voivodeship, there were above 63 million tonnes of sands and gravel within 47 deposits documented. The deposits resources are in the range between about 103 thousand tonnes and more than 11 million tonnes. The biggest of these deposits are as follows: Gałkówka-Zaruzie (11.67 million tonnes), Drogoszewo (8.82 million tonnes), Kuków XIV (4.45 million tonnes), Janowszczyzna IV – pole A (3.51 million tonnes), Czerwony Bór II (2.73 million tonnes), Knyszyn III (2.36 million tonnes), Suwałki VII (2.28 million tonnes), Janowszczyzna XI (2.02 million tonnes).. From all of the newly documented resources in the Voivodeship 80% are within 17 deposits with the resources volume between 1 million tonnes and 11.7 million tonnes. In third place, in terms of newly documented resources, there is Mazowieckie Voivodeship: 34.6 million tonnes (54 deposits). The biggest new deposits are: Chrzczony (6.1 million tonnes), Prosienica VI (3.88 million tonnes), Dębinki V (2.85 million tonnes), Pułtusk II (2.02 million tonnes). Moreover, among the biggest deposits there are also: Święcianowo VII (9 million tonnes) and Moryń III (4.25 million tonnes) located in Zachodniopomorskie Voivodeship; Ligota Mała I (7.34 million tonnes) located in Dolnośląskie Voivodeship; Potępa (7.05 million tonnes) located in Śląskie Voivodeship; Paruszowice 1 (6.92 million tonnes), Anna Olesno (5.66 million tonnes) and Maria Olesno (5.61 million tonnes) located in Opolskie Voivodeship; Czarna Sędziszowska (6.54 million tonnes) located in Podkarpackie Voivodeship; Gruczno I (5.6 million tonnes) and Pędzewo VIII (5.19 million tonnes) located in Kujawsko-Pomorskie Voivodeship, Gietrzwałd I (5.04 million tonnes), Gietrzwałd II (4.84 million tonnes) and Niedźwiedzkie III (4.19 million tonnes) located in Warmińsko-Mazurskie Voivodeship, Głażewo MK (4.95 million tonnes) located in Wielkopolskie Voivodeship. The smallest resources amount i.e. 4.09 million tonnes (in 6 deposits) was documented in Świętokrzyskie Voivodeship, moreover there were 6.93 million tonnes (in 6 deposits) and 14.6 million tonnes (in 11 deposits) documented in Małopolskie and Lubuskie Voivodeships, respectively. In 2019, there were also 12.13 million tonnes of the anticipated sub-economic resources documented. Most of them in Ligota Mała I deposit (3 million tonnes) located in Dolnośląskie Voivodeship, Czarna Sędziszowska (2.62 million tonnes) located in Podkarpackie Voivodeship, Strzelęcino III (2.02 million tonnes) located in Pomorskie Voivodeship, Czaple (0.84 million tonnes) located in Zachodniopomorskie Voivodeship, Paruszowice 1 (0.69 million tonnes) located in Opolskie Voivodeship.
- The verification and updating of resources due to the deposit area enlargement or deepening of its range, the resources updating as a result of a longtime exploitation, the change of a deposit usage and its designation in the site management plans within the borders of which the deposit was documented, or the resources settlement after an allocation of new deposits documented within the area of previously explored. The most significant resources growths were recorded for the following deposits: Woliczno IV (11.48 million tonnes) and Wietszyno (7.05 million tonnes) located in Zachodniopomorskie Voivodeship, Brzezie nad Odrą (8.6 million tonnes), Lubomia III (7.78 million tonnes), Racibórz II – Zbiornik 4 (2.54 million tonnes) and Bojszowy II/1 (6.6 million tonnes) located in Śląskie Voivodeship; Gościszka (5.75 million tonnes), Olszany VII (2.05 million tonnes) and Sokołówek (2.04 million tonnes) located in Mazowieckie Voivodeship; Prusim I (4.62 million tonnes), Gołębowo MD (4.06 million tonnes), Stara Dąbrowa I-Wschód (3.57 million tonnes) and Wincentów V (2.01 million tonnes) located in Wielkopolskie Voivodeship; Kołaczkowo I (3.83 million tonnes) located in Kujawsko-Pomorskie Voivodeship; Kaimy IV (2.25 million tonnes) located in Podlaskie Voivodeship; Wróblowa (2.21 million tonnes) located in Podkarpackie Voivodeship; Stefanówka (2.01 million tonnes) located in Lubelskie Voivodeship;
- The balance of the resources drops and growths, established in the new documentations with recalculated resources or being the results of the current resources verification connected with the exploitation (more than 54 million tonnes).
The resources decreased by:
- The output (182.81 million tonnes).
- The crossing 179 aggregate deposits out from the domestic resources balance – about 37.4 million tonnes in total. The biggest resources volumes were crossed out from the i.a. deposits: Krzeczów III (−2.37 million tonnes) located in Łódzkie Voivodeship; Dwory-Mańki (−1.9 million tonnes) and Kłokoczyn Pod Lasem (−1.14 million tonnes) located in Małopolskie Voivodeship; Gąsawy-Nogaj (−1.67 million tonnes), Trojanów II (−1.16 million tonnes) and Jelonki-Przyborowie 3 (−1.15 million tonnes) located in Mazowieckie Voivodeship; Drahle VI (−1.19 million tonnes) in Podlaskie Voivodeship; Nowa I (−1.05 million tonnes) located in Dolnośląskie Voivodeship; Pilewice III (−1.01 million tonnes) located in Kujawsko-Pomorskie Voivodeship.
- The new documentation with recalculated (decreased) resources elaborated for i.a. deposits: Bojszowy II (−6.33 million tonnes) located in Śląskie Voivodeship, Pisarzowice (−1.81 million tonnes) located in Dolnośląskie Voivodeship, Mrzezino I (−1.55 million tonnes), Głazica (−0.97 million tonnes) and Kębłowo (−0.96 million tonnes) located in Pomorskie Voivodeship, Racibórz I-Zbiornik (−1.48 million tonnes) located in Śląskie Voivodeship; Łapka 3 (−1.45 million tonnes) located in Warmińsko-Mazurskie Voivodeship, Kanigówek (−1.42 million tonnes) and Kamińsk (−1.11 million tonnes) located in Mazowieckie Voivodeship, Główczyce (−1.35 million tonnes) located in Opolskie Voivodeship.
The resources growth in Poland, similarly to the previous years, was the result of the increases in most of Voivodeships. The most significant increases were recorded in Voivodeships preparing the infrastructural investments i.a. Pomorskie, Podlaskie, Zachodniopomorskie, Kujawsko-Pomorskie. The table below shows changes within anticipated economic resources in particular Voivodeships in 2019.
|
Increases (thousand tonnes)
|
Decreases (thousand tonnes)
|
||
| Pomorskie Voivodeship | 53,120 | Małopolskie Voivodeship | −13,161 |
| Podlaskie Voivodeship | 35,227 | Dolnośląskie Voivodeship | −1,453 |
| Zachodniopomorskie Voivodeship | 35,041 | Baltic Sea | −1,051 |
| Kujawsko-Pomorskie Voivodeship | 24,404 | ||
| Śląskie Voivodeship | 24,024 | ||
| Wielkopolskie Voivodeship | 23,511 | ||
| Mazowieckie Voivodeship | 22,363 | ||
| Podkarpackie Voivodeship | 17,102 | ||
| Opolskie Voivodeship | 15,993 | ||
| Warmińsko-Mazurskie Voivodeship | 10,905 | ||
| Lubuskie Voivodeship | 9,851 | ||
| Lubelskie Voivodeship | 9,579 | ||
| Łódzkie Voivodeship | 6,609 | ||
| Świętokrzyskie Voivodeship | 221 | ||
| Total increases | 287,950 | Total decreases | −15,665 |
The biggest numbers of deposits are nowadays documented in the following Voivodeships: Mazowieckie (1,410), Wielkopolskie (1,232), Lubelskie (973), Łódzkie (861), Warmińsko-Mazurskie (821) and Podkarpackie (760).
The Voivodeships with the biggest documented resources are: Dolnośląskie (2,309 million tonnes), Małopolskie (1,813 million tonnes), Podlaskie (1,692 million tonnes), Opolskie (1,423 million tonnes), Podkarpackie (1,319 million tonnes) and Mazowieckie (1,336 million tonnes).
The resources of deposits covered by a detailed exploration (A, B and C1 categories) are equal 11,926.45 million tonnes and account for 60% of the total resources. The resources covered by the preliminary exploration (C2 and D categories) account for 40% of the total resources and amount to 7,816.20 million tonnes. The resources of exploited deposits, being equal 5,961.83 million tonnes, account for 30% of the total resources. These resources decreased by 39.4 million tonnes in comparison with 2018. Non-exploited deposits contain 12,076.43 million tonnes (61%) of resources (the growth by 167.32 million tonnes), whereas resources of abandoned deposits are equal 1,704.39 million tonnes. The latter resources increased by 144.36 million tonnes.
The economic resources amounted in 2019 to 4,168.82 million tonnes and increased in comparison with the previous year by 107 million tonnes. The economic resources, established for the exploited deposits, are equal 3,498.09 million tonnes accounting for 58.7% of their documented resources. The distribution of the developed anticipated economic resources, the economic resources and exploited deposits in particular Voivodeships (in million tonnes) as of the end of 2019 was as follows:
|
Voivodeship/Region
|
Developed resources (million tonnes)
|
||
| Anticipated economic | Economic | Anticipated economic of exploited deposits | |
| Baltic Sea | 90 | 89 | 90 |
| Dolnośląskie Voivodeship | 710 | 377 | 613 |
| Kujawsko-Pomorskie Voivodeship | 153 | 101 | 106 |
| Lubelskie Voivodeship | 147 | 74 | 120 |
| Lubuskie Voivodeship | 314 | 158 | 283 |
| Łódzkie Voivodeship | 356 | 208 | 275 |
| Małopolskie Voivodeship | 440 | 150 | 351 |
| Mazowieckie Voivodeship | 406 | 259 | 278 |
| Opolskie Voivodeship | 322 | 138 | 294 |
| Podkarpackie Voivodeship | 249 | 117 | 182 |
| Podlaskie Voivodeship | 854 | 553 | 560 |
| Pomorskie Voivodeship | 360 | 289 | 304 |
| Śląskie Voivodeship | 284 | 89 | 216 |
| Świętokrzyskie Voivodeship | 79 | 39 | 74 |
| Warmińsko-Mazurskie Voivodeship | 386 | 304 | 250 |
| Wielkopolskie Voivodeship | 477 | 277 | 347 |
| Zachodniopomorskie Voivodeship | 334 | 276 | 246 |
In 2019, the output of sands and gravel amounted to 182.81 million tonnes. In comparison with the previous year it dropped by 14.19 million tonnes that is by 7.2%. The exploitation decreased in 11 out of 16 Voivodeships and in 8 of them by more than 1 million tonnes.. The output volume is strictly connected with the road investments sector where the demand for the raw material is the most significant. Therefore, the production dropped in the regions in which the building processes of domestic roads, expressways and highways ended or were in the final phase. The biggest output drops were recorded in the following Voivodeship: Zachodniopomorskie – resulted from the putting into service the S6 road; Mazowieckie – where the aggregates were delivered for the S17 and A2 roads building; Kujawsko-Pomorskie Voivodeship – where the S5 road is almost finished. Moreover, the last year drop, prospected in forecasts, was the result of the economic situation worsening – connected with i.a. the share of the infrastructural programs co-financed by the EU. The output changes in 2019 in particular Voivodeships is presented below:
|
The output in comparison with 2018
|
The difference (thousand tonnes) |
The difference (%) |
| Total | −14,192 | −7.2 |
| Podkarpackie Voivodeship | 1,653 | 21.6 |
| Łódzkie Voivodeship | 1,205 | 15.1 |
| Podlaskie Voivodeship | 834 | 3.3 |
| Opolskie Voivodeship | 577 | 7.0 |
| Świętokrzyskie Voivodeship | 543 | 26.7 |
| Lubelskie Voivodeship | 458 | 7.6 |
| Baltic Sea | 447 | 53.9 |
| Małopolskie Voivodeship | −46 | −0.3 |
| Lubuskie Voivodeship | −989 | −17.3 |
| Wielkopolskie Voivodeship | −1,081 | −8.3 |
| Śląskie Voivodeship | −1,520 | −14.5 |
| Pomorskie Voivodeship | −1,966 | −10.3 |
| Dolnośląskie Voivodeship | −1,976 | −12.5 |
| Warmińsko-Mazurskie Voivodeship | −2,111 | −11.9 |
| Kujawsko-Pomorskie Voivodeship | −2,635 | −29.2 |
| Mazowieckie Voivodeship | −3,001 | −16.8 |
| Zachodniopomorskie Voivodeship | −4,584 | −26.7 |
The number of sands and gravel deposit in 2019 amounted to 10,504 including 2,626 of exploited deposits (in this group there are deposits crossed out from ‘The balance…’ and those for which the concessions expired and the deposits were marked as abandoned). In comparison with the previous year (2,667 deposits) the number has slightly decreased. The number of non-exploited deposits increased by 250 (from 7,628 in 2018 to 7,878 in 2019) that is more than the total growth. The structure of the deposits divided according to the output volume in particular Voivodeships in 2019 is presented below:
|
|
Output (thousand tonnes)
|
Exploited deposits
|
|||||
|
<50
|
50-200
|
200-500
|
500-1,000
|
>1,000
|
Number
|
(%)
|
|
| Baltic Sea | 1 | 0 | 0 | 0 | 1 | 2 | 67 |
| Dolnośląskie Voivodeship | 63 | 25 | 11 | 10 | 0 | 109 | 23 |
| Kujawsko-Pomorskie Voivodeship | 117 | 28 | 6 | 0 | 0 | 151 | 21 |
| Lubelskie Voivodeship | 190 | 28 | 3 | 1 | 0 | 222 | 23 |
| Lubuskie Voivodeship | 34 | 20 | 3 | 2 | 0 | 59 | 22 |
| Łódzkie Voivodeship | 211 | 28 | 9 | 2 | 0 | 250 | 29 |
| Małopolskie Voivodeship | 43 | 25 | 27 | 4 | 0 | 99 | 26 |
| Mazowieckie Voivodeship | 327 | 41 | 12 | 4 | 0 | 384 | 27 |
| Opolskie Voivodeship | 20 | 14 | 9 | 6 | 0 | 49 | 25 |
| Podkarpackie Voivodeship | 144 | 33 | 9 | 1 | 0 | 187 | 25 |
| Podlaskie Voivodeship | 185 | 41 | 7 | 2 | 8 | 243 | 31 |
| Pomorskie Voivodeship | 102 | 37 | 16 | 2 | 2 | 159 | 22 |
| Śląskie Voivodeship | 25 | 15 | 10 | 3 | 1 | 54 | 18 |
| Świętokrzyskie Voivodeship | 45 | 8 | 4 | 0 | 0 | 57 | 28 |
| Warmińsko-Mazurskie Voivodeship | 129 | 28 | 11 | 4 | 2 | 174 | 21 |
| Wielkopolskie Voivodeship | 306 | 43 | 7 | 2 | 0 | 358 | 29 |
| Zachodniopomorskie Voivodeship | 33 | 22 | 8 | 4 | 2 | 69 | 18 |
| Number of deposits | 1,975 | 436 | 152 | 47 | 16 | 2,926 | |
Natural sands and gravel are also recovered during the exploitation of brown coal deposits. In 2019 the output of the raw material from non-documented deposits during the exploitation in the Bełchatów mine from the Szczerców field amounted to 218.28 thousand tonnes, whereas the output in Turów was equal 40.02 thousand tonnes of sands and sands with gravel.
Figure below shows changes in domestic resources and production of sand and gravel in Poland in the years 1989-2019.
The prognostic resources of the natural sandy-gravelly aggregates are assessed to be equal more than 13 billion tonnes*. The occur quite evenly in Poland. The areas of the prospective raw material occurrences, in contrast to the prognostic ones, are of a lower exploration category – due to the evaluation based on the indirect indicators, the lack of quality tests and non-assessed resources amount.
Prepared by: Dariusz Brzeziński, Anna Kalinowska, Wojciech Miśkiewicz, Joanna Stawierej
* Kozłowska O., Smakowski T., Miśkiewicz W., 2020 – ‘Kruszywo naturalne piaskowo-żwirowe (natural aggregates)’. W: ‘Bilans perspektywicznych zasobów kopalin Polski wg stanu na 31.12.2018 r.’ (red. Szamałek K., Szuflicki M., Mizerski W.): 258-275. PIG-PIB, Warszawa.
2018
Two major groups of natural sandy-gravelly aggregates are differentiated: a coarse aggregate group, comprising gravels and sand-gravel mix (sandy-gravelly aggregates), and that of fine aggregates – sandy. Sand deposits in Poland are usually evenly arranged and only southern Voivodeships are characterized by their shortage (map). The course aggregates deposits – particularly marketable – occur unevenly and especially the central Voivodeships are characterized by the deficiency.
The bulk of Polish natural sand and gravel deposits are of the Quaternary age. The share of deposits of the older formations: Pliocene, Miocene and Liassic in the age is subordinate.
The quality of a raw material, and especially the deposits homogeneity, depends largely on a genetic type of a given deposit. Among deposits of the Quaternary age there are three genetic types: glacial, fluvioglacial and fluvial (river). They are characterized by a zonality of the occurrence.
In the southern part of Poland, in the Carpathian-Sudetic zone, the most common are deposits of the fluvial (river) origin. In the Sudety Mts., the deposits of sandy-gravel higher terraces of the Pleistocene age prevail, built mainly of the crystalline rocks and sandstones. In turn, in the Carpathian region the raw material basis comprises mainly gravelly and sandy-gravelly deposits occurring on flood-plain terraces as well as valley side terraces rising above flood plains. The Carpathian deposits are characterized by a predominance of the material coming from a disintegration of flysch rocks, except for those of the Dunajec River valley, showing a fairly high contribution of the crystalline rocks from the Tatry Mts.
In northern and central Poland – on the Polish Lowlands, the most important are deposits of a glacial (an accumulation platform of front moraine) and fluvioglacial (outwash plain and esker) origin and resulting from a river accumulation. Deposits from the northern part of that area are represented by gravelly-sandy accumulations mainly comprising the Scandinavian material – debris of crystalline rocks and limestones with an admixture of quartz and sandstones. In the central and southern parts of this region, the deposits are mainly formed of sandy sediments with a significant share of a debris of local rocks.
According to the Regulation of the Minister of the Environment of the 1st of July 2015 regarding the geological documentation of a raw material deposit, excluding a hydrocarbons field , establishing the limit values of the parameters that define the deposit and its borders, a feldspar-quartzitic sand deposit with the sand content above 75% should be characterized by the thickness not smaller than 2 m, the ratio of cover to deposit series not higher than 0.3 and the content of silt fraction below 10%, while a sand, gravelly-sandy and sandy-gravelly deposit with the sand content below 75% should be characterized by the thickness not smaller than 2 m, with the ratio of cover to deposit series not higher than 1.0 and the content of a silt fraction below 15%.
The sand and gravel deposits occurrence in Poland is presented on the map.
Table 1 shows resources and the current state of exploration and development of natural sand and gravel aggregates.
Anticipated economic resources of natural aggregates as of 31.12.2018 totaled 19,470.38 million tonnes. The resources increased by 216.61 million tonnes (1.13%) in relation to the previous year. The growth dynamism decreased in comparison with the previous year when it was equal 1.25%.
Natural sandy-gravelly aggregates have being documented within 4 subtypes: sands, sands with gravel, gravel, loamy and silty sands. The resources of sands with the sand content above 75% amounted to 8,715.08 million tonnes (increased by 184.2 million tonnes in comparison with 2017) from which 2,480.21 million tonnes are within exploited deposits. The resources of gravelly-sandy and sandy-gravelly aggregates with the sand content between 30% and 75% amounted to 9,728.91 million tonnes (the growth by 34.61 million tonnes). The resources of gravel (with the sand content <30%) amounted to 996.82 million tonnes (the drop by 1.97 million tonnes) and the resources of silty, loamy sands amounted to 29.56 million tonnes (the drop by 0.13 million tonnes).
In particular Voivodeship the distribution of the anticipated economic resources (in million tonnes) of natural aggregates subtypes as of the end of 2018 was as follows:
|
Voivodeship/ Region
|
Sand | Sand with gravel |
Gravel | Silty, loamy sand |
| Baltic Sea | 0 | 136 | 0 | 0 |
| Dolnośląskie | 551 | 1,600 | 146 | 14 |
| Kujawsko-Pomorskie | 369 | 46 | 0 | 0 |
| Lubelskie | 994 | 21 | 0 | 0 |
| Lubuskie | 602 | 564 | 0 | 0 |
| Łódzkie | 574 | 148 | 0 | 0 |
| Małopolskie | 93 | 1,187 | 545 | 0 |
| Mazowieckie | 1,036 | 278 | 0 | 0 |
| Opolskie | 176 | 1,077 | 152 | 1 |
| Podkarpackie | 671 | 542 | 84 | 5 |
| Podlaskie | 121 | 1,535 | 0 | 0 |
| Pomorskie | 651 | 476 | 0 | 2 |
| Śląskie | 360 | 439 | 67 | 0 |
| Świętokrzyskie | 622 | 21 | 2 | 0 |
| Warmińsko-Mazurskie | 316 | 975 | 1 | 0 |
| Wielkopolskie | 896 | 168 | 0 | 1 |
| Zachodniopomorskie | 683 | 517 | 0 | 6 |
The resources increased due to:
- The including into ‘The balance…’ 370 newly documented deposits with the total resources equal above 477.88 million tonnes. In 2018, the largest resources amount: 112.36 million tonnes (50 new deposits) was documented in Podlaskie Voivodeship. The biggest deposits are as follows: Drahle-Bohoniki (37.32 million tonnes), Bohoniki III (36.44 million tonnes), Ciemianka II (6.68 million tonnes), Stare Konopki (3.58 million tonnes), Kobylin I (2.32 million tonnes), Grzymały (2.24 million tonnes), Kuków XIII (2.09 million tonnes). The resources of the 9 biggest deposits amount to above 94 million tonnes that is 84% of the total resources documented in the Voivodeship. The remaining resources of 12.3 million tonnes in the volume (the range 0.5-1 million tonnes) are within 16 deposits and the resources of 5.8 million tonnes in the volume are within 24 deposits (mostly above 100 thousand tonnes). In the second best Warmińsko-Mazurskie Voivodeship, there were above 84 million tonnes of sands and gravel within 25 deposits documented. The deposits resources are in the range between about 90 thousand tonnes and 25 million tonnes. The biggest of these deposits are as follows: Prostki-Niedźwieckie (24.99 million tonnes), Jabłonowo I (16.55 million tonnes), Botowo VII (12.72 million tonnes), Kalbornia-Mosznica 1 (6.27 million tonnes), Botowo VI (5.02 million tonnes). From all of the newly documented resources in the Voivodeship 92% are within 10 deposits with the resources volume between 1 million tonnes and 25 million tonnes. In third place, in terms of newly documented resources, there is Mazowieckie Voivodeship: 38.9 million tonnes (54 deposits). The biggest new deposits are: Stylągi I (9.09 million tonnes), Kondrajec Szlachecki (6.44 million tonnes), Rudno Jeziorowie IX (3.06 million tonnes), Kamień I (2.39 million tonnes). The 11 new deposits contain more than 30 million tonnes, while the remaining 43 deposits above 12 million tonnes. Moreover, among the biggest deposits there are also: Białobrzezie (19.15 million tonnes) and Biała (5.52 million tonnes) located in Dolnośląskie Voivodeship; Chrostkowo Nowe II (5.76 million tonnes) located in Kujawsko-Pomorskie Voivodeship; Gryżyce II (13.37 million tonnes) located in Lubuskie Voivodeship; Bądków (6.39 million tonnes) located in Łódzkie Voivodeship; Bukówka (8.58 million tonnes) and Gołębiewko IV (7.21 million tonnes) located in Pomorskie Voivodeship; Dargocice II (6.49 million tonnes), Biała I (6.28 million tonnes) located in Zachodniopomorskie Voivodeship. The smallest resources amount i.e. 1.03 million tonnes (in 4 deposits) was documented in Opolskie Voivodeship, moreover there were 4 million tonnes (in 3 deposits) and 5.26 million tonnes (in 3 deposits) documented in Śląskie and Świętokrzyskie Voivodeships, respectively. Trąbki 1 deposit located in Zachodniopomorskie Voivodeship, previously enlisted in sands for the production of the lime-sand bricks, was reclassified as sands and gravel. In 2018, there were also 8.16 million tonnes of anticipated sub-economic resources documented. Most of them in Rakowo Piskie II (3.86 million tonnes) and Stare Konopki (1.55 million tonnes) located in Warmińsko-Mazurskie and Podlaskie Voivodeships, respectively.
- The verification and updating of resources due to the deposit area enlargement or deepening of its range, the resources updating as a result of a longtime exploitation, the change of a deposit usage and its designation in the site management plans wihitn the borders of which the deposit was documented, or the resources settlement after an allocation of new deposits documented within the area of previously explored. The most significant resources growths were recorded for the following deposits: Mosty (6.79 million tonnes) located in Zachodniopomorskie Voivodeship; Prosienica II/2 (5.13 million tonnes) and Pieńki (4.11 million tonnes) located in Mazowieckie Voivodeship; Ludkowo VII (3.65 million tonnes) located in Kujawsko-Pomorskie Voivodeship; Jerzmanowice (3.51 million tonnes) located in Dolnośląskie Voivodeship; Radachów (2.84 million tonnes) located in Lubuskie Voivodeship; Wólka Gościeradowska (2.74 million tonnes) located in Lubelskie Voivodeship; Grzybowo – Lizaki (2.76 million tonnes) located in Pomorskie Voivodeship; Samborzec (2.33 million tonnes) and Brody Iłżeckie 1 (2.21 million tonnes) located in Świętokrzyskie Voivodeship; Szałstry I (2.22 million tonnes) located in Warmińsko-Mazurskie Voivodeship; Dęby Szlacheckie-I (2.11 million tonnes) located in Wielkopolskie Voivodeship.
The resources decreased by:
- The output (197.01 million tonnes).
- The crossing 199 aggregate deposits out from the domestic resources balance – about 42.5 million tonnes in total. The biggest resources volumes were crossed out from the i.a. deposits: Suków II (−4.09 million tonnes) and Brody Iłżeckie (−1.02 million tonnes) located in Świętokrzyskie Voivodeship; Bohoniki II (−2.78 million tonnes) and Duchny Wieluny (−1.03 million tonnes) located in Podlaskie Voivodeship; Goliszów (−2.69 million tonnes) and Jakuszów (−1.16 million tonnes) located in Dolnośląskie Voivodeship; Lubieszów (−2.01 million tonnes) in Opolskie Voivodeship; Dźwierzno J 1 (−1.16 million tonnes) located in Kujawsko-Pomorskie Voivodeship; Woliczno W (−1.1 million tonnes) located in Zachodniopomorskie Voivodeship; Kowala Duszocina (−1.06 million tonnes) located in Mazowieckie Voivodeship.
- The new documentation with recalculated (decreased) resources elaborated for i.a. deposits: Przyborów-Żwiry (−8.38 million tonnes) and Brzegi (−2.90 million tonnes) located in Małopolskie Voivodeship, Kalbornia-Mosznica (−6.17 million tonnes), Ruś (−2.19 million tonnes) and Jabłonowo (−2.16 million tonnes) located in Warmińsko-Mazurskie Voivodeship, Racibórz II-Zbiornik (−4.85 million tonnes) located in Śląskie Voivodeship; Górka Lubartowska (−4.40 million tonnes) located in Lubelskie Voivodeship, Gostomie III (−4.38 million tonnes) located in Pomorskie Voivodeship, Nowogród Bobrzański – Zbiornik (−3.74 million tonnes) and Miodnica (−2.37 million tonnes) located in Lubuskie Voivodeship, Legnica-pole Wschodnie (−2.27 million tonnes) located in Dolnośląskie Voivodeship.
- The balance of resources decreases and increases specified in the new documentation with recalculated resources and resources changes being the result of the current resources verification due to the exploitation – about −22 million tonnes.
The resources growth in Poland, similarly to the previous years, was the result of the increases in most of Voivodeships. The table below shows changes within anticipated economic resources in particular Voivodeships in 2018 (thousand tonnes).
|
Increases
(thousand tonnes) |
Decreases
(thousand tonnes) |
||
| Podlaskie Voivodeship | 78,581 | Baltic Sea | −526 |
| Warmińsko-Mazurskie Voivodeship | 56,021 | Opolskie Voivodeship | −11,660 |
| Mazowieckie Voivodeship | 30,571 | Śląskie Voivodeship | −12,784 |
| Wielkopolskie Voivodeship | 22,951 | Małopolskie Voivodeship | −23,735 |
| Zachodniopomorskie Voivodeship | 17,672 | ||
| Łodzkie Voivodeship | 14,573 | ||
| Dolnośląskie Voivodeship | 13,992 | ||
| Pomorskie Voivodeship | 7,402 | ||
| Kujawsko-Pomorskie Voivodeship | 7,333 | ||
| Podkarpackie Voivodeship | 6,482 | ||
| Lubelskie Voivodeship | 4,421 | ||
| Lubuskie Voivodeship | 3,273 | ||
| Świętokrzyskie Voivodeship | 2,038 | ||
| Total increases | 265,312 | Total decreases | −48,705 |
The biggest numbers of deposits are nowadays documented in the following Voivodeships: Mazowieckie (1,379), Wielkopolskie (1,220), Lubelskie (955), Łódzkie (859) and Warmińsko-Mazurskie (795).
The Voivodeships with the biggest documented resources are: Dolnośląskie (2,310 million tonnes), Małopolskie (1,826 million tonnes), Podlaskie (1,656 million tonnes), Opolskie (1,407 million tonnes), Podkarpackie (1,302 million tonnes) and Mazowieckie (1,313 million tonnes).
The resources of deposits covered by a detailed exploration (A, B and C1 categories) are equal 11,652.65 million tonnes and account for 60% of the total resources. The resources covered by the preliminary exploration (C2 and D categories) account for 40% of the total resources and amount to 7,817.73 million tonnes. The resources of exploited deposits, being equal 6,001.23 million tonnes, account for 31% of the total resources. These resources increased by 21.61 million tonnes in comparison with 2017. Non-exploited deposits contain 11,909.11 million tonnes (61%) of resources (the growth by 130.30 million tonnes), whereas resources of abandoned deposits are equal 1,560.03 million tonnes. The latter resources increased by 64.71 million tonnes.
In 2018, the output of sands and gravel amounted to 197.01 million tonnes. In comparison with the previous year it growth by 10.71 million tonnes that is 5.7%. The exploitation increased from 11 out of 16 Voivodeship and from the Baltic Sea area. The output volume is strictly connected with the road investments sector where the demand for the raw material is significant. Therefore, the production grew in the regions in which the building process of domestic roads, expressways and highways was being carried out. The output changes in 2018 in particular Voivodeships is presented below:
|
The output in comparison with 2017
|
The difference (thousand tonnes) |
The difference (%) |
| Total | 10,708 | 5.7 |
| Podlaskie Voivodeship | 4,151 | 20.0 |
| Pomorskie Voivodeship | 3,303 | 20.8 |
| Kujawsko-Pomorskie Voivodeship | 3,252 | 56.5 |
| Łódzkie Voivodeship | 1,334 | 20.1 |
| Opolskie Voivodeship | 928 | 12.6 |
| Śląskie Voivodeship | 807 | 8.4 |
| Dolnośląskie Voivodeship | 800 | 5.3 |
| Podkarpackie Voivodeship | 334 | 4.6 |
| Mazowieckie Voivodeship | 237 | 1.3 |
| Baltic Sea | 209 | 33.8 |
| Lubuskie Voivodeship | 24 | 0.4 |
| Małopolskie Voivodeship | 11 | 0.1 |
| Warmińsko-Mazurskie Voivodeship | −343 | −1.9 |
| Świętokrzyskie Voivodeship | −541 | −21.0 |
| Lubelskie Voivodeship | −713 | −10.6 |
| Wielkopolskie Voivodeship | −1,539 | −10.5 |
| Zachodniopomorskie Voivodeship | −1,547 | −8.3 |
The number of sands and gravel deposit in 2018 amounted to 10,295 including 2,667 of exploited deposits. In comparison with the previous year (2,659 deposits) the number has slightly changed. The number of non-exploited deposits increased by 170 (from 7,458 in 2017 to 7,628 in 2018) that is more or less the total growth. The structure of the deposits divided according to the output volume in particular Voivodeships is presented below:
|
Voivodeship/ Region
|
Output
(thousand tonnes) |
Exploited deposits
|
|||||
|
<50< div>
|
50-200
|
200-500
|
500-1,000
|
>1,000
|
Number
|
%
|
|
| Baltic Sea | 0 | 0 | 0 | 1 | 0 | 1 | 33 |
| Dolnośląskie | 66 | 27 | 14 | 7 | 1 | 115 | 24 |
| Kujawsko-Pomorskie | 108 | 30 | 11 | 1 | 0 | 150 | 21 |
| Lubelskie | 180 | 21 | 4 | 1 | 0 | 206 | 22 |
| Lubuskie | 44 | 16 | 4 | 3 | 0 | 67 | 25 |
| Łódzkie | 204 | 33 | 6 | 1 | 0 | 244 | 28 |
| Małopolskie | 47 | 28 | 21 | 5 | 0 | 101 | 26 |
| Mazowieckie | 331 | 55 | 12 | 6 | 0 | 404 | 29 |
| Opolskie | 25 | 13 | 5 | 6 | 1 | 50 | 27 |
| Podkarpackie | 142 | 37 | 7 | 0 | 0 | 186 | 25 |
| Podlaskie | 179 | 29 | 14 | 4 | 7 | 233 | 31 |
| Pomorskie | 100 | 44 | 15 | 6 | 2 | 167 | 24 |
| Śląskie | 30 | 10 | 12 | 5 | 1 | 58 | 20 |
| Świętokrzyskie | 46 | 4 | 2 | 0 | 0 | 52 | 25 |
| Warmińsko-Mazurskie | 139 | 23 | 16 | 2 | 5 | 185 | 23 |
| Wielkopolskie | 296 | 57 | 7 | 0 | 1 | 361 | 30 |
| Zachodniopomorskie | 43 | 21 | 13 | 7 | 3 | 87 | 23 |
| Number of deposits | 1,980 | 448 | 163 | 55 | 21 | 2,667 | 26 |
Natural sands and gravel are also recovered during the exploitation of brown coal deposits. In 2018 the output of the raw material from non-documented deposits during the exploitation in the Bełchatów mine from the Szczerców field amounted to 246.34 thousand tonnes, whereas the output in Turów was equal 68 thousand tonnes.
Figure below shows changes in domestic resources and production of sand and gravel in Poland in the years 1989-2018.
Prepared by: Dariusz Brzeziński, Anna Kalinowska, Wojciech Miśkiewicz, Joanna Stawierej
2017
Two major groups of natural sand-gravel aggregates are differentiated: a coarse aggregate group, comprising gravels and sand-gravel mix, and that of fine aggregates – comprising sands. Sand deposits in Poland are usually evenly arranged and only southern voivodeships are characterized by their shortage. The course aggregates deposits – particularly marketable – occur unevenly and especially the central voivodeships are characterized by the deficiency.
The bulk of Polish natural aggregate deposits are of the Quaternary age. The share of deposits of the Pliocene, Miocene and Liassic age is subordinate.
The quality of a raw material (especially its homogeneity) depends largely on a genetic type of a given deposit. Among deposits of the Quaternary age there are three genetic types: glacial, fluvioglacial and fluvial (river). They are characterized by a zonality of the occurrence.
In the southern Poland, in the Carpathian-Sudetic zone, the most common are deposits of the fluvial origin. In the Sudety Mts., the most common deposits are those of sandy-gravel higher terraces of the Pleistocene age, built mainly of the detritus of sandstones and crystalline rocks. In turn, in the Carpathian region the raw material basis comprises mainly gravel and sandy gravel deposits occurring on flood-plain terraces as well as valley side terraces rising above flood plains. The Carpathian deposits are characterized by a predominance of the material coming from a disintegration of flysch rocks, except for those of the Dunajec River valley, showing a fairly high contribution of crystalline rocks from the Tatry Mts.
In northern and central Poland (Polish Lowlands), the most important are deposits of a glacial (an accumulation platform of front moraine) and fluvioglacial (outwash plain and esker) origin and resulting from a river accumulation. Deposits from the northern part of that area are represented by gravel-sandy accumulations mainly comprising the Scandinavian material – debris of crystalline rocks and limestones with an admixture of quartz and sandstones. In the central and southern parts of this region, the deposits are mainly formed of sandy sediments with a significant share of a debris of local rocks.
According to the Regulation of the Minister of the Environment of the 1st of July 2015 a feldspar-quartzitic sand deposit with the sand content above 75% should be characterized by the thickness not smaller than 2 m, the ratio of cover to deposit series not higher than 0.3 and the content of grains of silt fraction below 10%, while a sand, graveled-sand and sandy-gravel deposit with the sand content below 75% should be characterized by the thickness not smaller than 2 m, the ratio of cover to deposit series not higher than 1.0 and the content of grains of a silt fraction below 15%.
The sand and gravel deposits occurrence in Poland is presented on the map.
Table 1 shows resources and the current state of exploration and development of natural sand and gravel aggregates.
Anticipated economic resources of natural aggregates as of 31.12.2017 totaled 19,253.77 million tonnes. The resources increased by 237.29 million tonnes (1.25%) in relation to the previous year. The growth dynamism decreased in comparison with the previous year when it was equal 2.02%.
Sand and gravel deposits have being documented within 4 subtypes: sand, sand and gravel, gravel, loamy and silty sand. The resources of sands with the sand content above 75% amounted to 8,530.89 million tonnes (increased by 272.83 million tonnes in comparison with 2016) from which 2,396.27 million tonnes are within exploited deposits. The resources of graveled-sands and sandy-gravel sands with the sand content between 30% and 75% amounted to 9,694.30 million tonnes (decreased by 97.74 million tonnes). The resources of gravel (with the sand content <30%) amounted to 998.79 million tonnes (increased by 61.33 million tonnes) and the resources of loamy and silty sands amounted to 29.69 million tonnes (increased by 0.94 million tonnes).
The resources increased due to:
- The including in ‘The balance…’ 390 new deposits documented in 2017 with anticipated economic resources equal above 424.02 million tonnes. The largest resources where documented within 59 deposits in Wielkopolskie Voivodeship with resources equal 54.54 million tonnes. The largest deposits are: Igrzyna (7.95 million tonnes), Popowo I (7.68 million tonnes), Kaszczor KR V (6.14 million tonnes). The anticipated economic resources documented in Wielkopolskie Voivodeship in 2017 fall into the interval between 0.04 million tonnes and 8 million tonnes. Within 14 deposits with resources from about 1 million tonnes to 8 million tonnes there were almost 42 million tonnes of sand and gravel documented. The second largest, taking into account the resources volume, are 29 deposits documented in Podlaskie Voivodeship with resources equal 51.87 million tonnes. Among them the biggest deposits are: Kuków XII (30.85 million tonnes), Kisielnica II (4.81 million tonnes), Mroczki Stylągi II (1.94 million tonnes). In Pomorskie Voivodeship there were 50.81 million tonnes of anticipated economic resources within 30 new deposits documented. The most important are: Demlin VIII (8.8 million tonnes), Gapowo XIX (7.44 million tonnes), Kębłowo Nowowiejskie V (4.75 million tonnes), Gostomie XIV (4.5 million tonnes), Rychnowy II (4.22 million tonnes). Aside from deposits mentioned above, in Pomorskie Vovivodeship there were 25 new deposits documented with total anticipated economic resources equal 21 million tonnes – within the resources range from 16 thousand tonnes to 3.6 million tonnes. Moreover, among the biggest deposits there are also: Topola-Śrem (20.96 million tonnes) in Dolnośląskie Voivodeship and Bierawa 2 (9.8 million tonnes) in Opolskie Voivodeship, Łapka 3 (9.3 million tonnes) and Szczepankowo (6.75 million tonnes) in Warmińsko-Mazurskie Voivodeship, Dołha 2 (9.27 million tonnes), Górka Lubartowska-Niedźwiada (4.84 million tonnes) in Lubelskie Voivodeship. The least anticipated economic resources i.e. 1.43 million tonnes within 6 deposits were documented in Świętokrzyskie Voivodeship, 10.7 million tonnes within 9 deposits in Zachodniopomorskie Voivodeship and 12.54 million tonnes within 12 deposits in Lubuskie Voivodeship. In 2017 there were also 6 million tonnes of anticipated sub-economic resources documented – Pęglity deposit located in Warmińsko-Mazurskie Voivodeship classified previously to building ceramics raw materials was reclassified to sand and gravel.
- The verification and resources updating, resulting from the enlargement of a deposit area or the deepening of its range, the resources updating due to the long-term exploitation, the change of resources utilization or resources settlement after the new deposits allocation within already documented deposits. The largest resources increases were recorded in the following deposits: Dębowiec IV (30.3 million tonnes) in Lubuskie Voivodeship, Bobrowniki-Drahle (8.04 million tonnes), Drahle VIII (2.7 million tonnes) and Janowszczyzna X (2.19 million tonnes) in Podlaskie Voivodeship, Kuźnica Czarnkowska MD (6.17 million tonnes) in Wielkopolskie Voivodeship, Chróścice 4 (4.23 million tonnes) in Opolskie Voivodeship, Nowa Biała-Zagrody (2.82 million tonnes) in Małopolskie Voivodeship, Przecław (2.25 million tonnes) in Podkarpackie Voivodeship, Węsiory (2.85 million tonnes) in Pomorskie Voivodeship, Gąsów (2.55 million tonnes) in Mazowieckie Voivodeship). The anticipated economic resources drops caused by the new documentation with recalculated resources were recorded for i.a.: Legnica-pole Wschodnie – the former name Legnica-p.E (−4.24 million tonnes) in Dolnośląskie Voivodeship, Górka Lubartowska (−4 million tonnes) in Lubelskie Voivodeship, Deszczno-Łagodzin (−3.92 million tonnes) in Lubuskie Voivodeship, Haczów (−2.93 million tonnes) in Podkarpackie Voivodeship, Rękoraj (−2.06 million tonnes) in Łódzkie Voivodeship.
- The balance of the resources decreases and increases estimated in the new documentations with recalculated resources elaborated for already documented deposits and as a result of the current resources verification connected with the exploitation – about 46 million tonnes.
The resources decreased by:
- The output (186.30 million tonnes).
- The crossing out 192 deposits from ‘The balance…’ with the total anticipated economic resources equal about 46 million tonnes. The largest amount of the resources were deleted i.a. from the following deposits: Roztoka (−2.37 million tonnes), Wola Batorska-Grabina (−1.24 million tonnes) in Małopolskie Voivodeship, Lasocin 1 (−2.03 million tonnes), Owczary (−1.64 million tonnes), Rudnica (−1.44 million tonnes) in Lubuskie Voivodeship, Wymysłowo TJ III (−1.61 million tonnes) in Wielkopolskie Voivodeship, Nowa Wieś IX (−1.74 million tonnes) in Kujawsko-Pomorskie Voivodeship, Smolarzyny-1 (−1.65 million tonnes), Munina I-A (−1.36 million tonnes), Żupawa (−1.34 million tonnes) in Podkarpackie Voivodeship, Wąsosz 6 (−1.24 million tonnes) in Podlaskie Voivodeship.
The resources growth in Poland, similarly to the previous years, was the result of the increases in most of voivodeships. The table below shows changes within anticipated economic resources in particular voivodeships in 2017.
|
Increases (thousand tonnes)
|
Decreases (thousand tonnes)
|
||
| Wielkopolskie | 50,317 | Zachodniopomorskie | −8,635 |
| Podlaskie | 41,964 | Małopolskie | −3,879 |
| Pomorskie | 34,757 | Świętokrzyskie | −2,746 |
| Lubuskie | 27,635 | Baltic Sea | −23 |
| Opolskie | 20,729 | ||
| Mazowieckie | 20,333 | ||
| Lubelskie | 15,823 | ||
| Warmińsko-Mazurskie | 14,376 | ||
| Łódzkie | 8,522 | ||
| Dolnośląskie | 8,299 | ||
| Kujawsko-Pomorskie | 4,999 | ||
| Śląskie | 4,033 | ||
| Podkarpackie | 788 | ||
| Total increase | 252,575 | Total decrease | −15,283 |
The biggest numbers of deposits are located in Mazowieckie (1,340), Wielkopolskie (1,205), Lubelskie (930), Łódzkie (843) and Warmińsko-Mazurskie (778) Voivodeships.
Voivodeships with the biggest resources are: Dolnośląskie (2,296 million tonnes), Małopolskie (1,850 million tonnes), Podlaskie (1,578 million tonnes), Opolskie (1,418 million tonnes), Podkarpackie (1,296 million tonnes) and Mazowieckie (1,283 million tonnes).
The number of sand and gravel deposits amounted to 2,659 exploited deposits in 2017. The percentage contribution of resources within particular ranges is presented below:
|
Voivodeship
|
Output (thousand tonnes)
|
Exploited deposits
|
|||||
|
<50< div>
|
50-200
|
200-500
|
500-1,000
|
>1,000
|
Number of deposits
|
%
|
|
| Baltic Sea | 1 | 0 | 0 | 1 | 0 | 2 | 67 |
| Dolnośląskie | 64 | 28 | 15 | 7 | 1 | 115 | 25 |
| Kujawsko-Pomorskie | 115 | 16 | 4 | 2 | 0 | 137 | 19 |
| Lubelskie | 174 | 21 | 3 | 2 | 0 | 200 | 22 |
| Lubuskie | 44 | 19 | 3 | 3 | 0 | 69 | 26 |
| Łódzkie | 215 | 26 | 4 | 0 | 0 | 245 | 29 |
| Małopolskie | 59 | 30 | 18 | 5 | 0 | 112 | 28 |
| Mazowieckie | 332 | 41 | 13 | 7 | 1 | 394 | 29 |
| Opolskie | 27 | 12 | 7 | 5 | 0 | 51 | 28 |
| Podkarpackie | 134 | 30 | 9 | 0 | 0 | 173 | 23 |
| Podlaskie | 185 | 32 | 6 | 3 | 6 | 232 | 32 |
| Pomorskie | 93 | 39 | 8 | 6 | 2 | 148 | 22 |
| Śląskie | 35 | 16 | 8 | 2 | 2 | 63 | 22 |
| Świętokrzyskie | 49 | 9 | 1 | 1 | 0 | 60 | 29 |
| Warmińsko-Mazurskie | 150 | 26 | 18 | 5 | 2 | 201 | 26 |
| Wielkopolskie | 315 | 49 | 14 | 1 | 0 | 379 | 31 |
| Zachodniopomorskie | 35 | 21 | 12 | 7 | 3 | 78 | 22 |
| Number of deposits | 2,027 | 415 | 143 | 57 | 17 | 2,659 | 26 |
Resources within deposits covered by a detailed exploration (A, B, C1) amounted to 11,409.07 million tonnes and accounts for 59% of the total anticipated economic resources, with resources within deposits covered by a preliminary exploration (C2 and D categories) states for 41% – 7,844.69 million tonnes. Resources within exploited deposits amounted to 5,979.62 million tonnes and increased by 80.41 million tonnes in comparison with 2016 (they account for 31% of the total anticipated economic resources), resources within non-exploited deposits amounted to 11,778.82 million tonnes (61% of total resources) and increased by 79.89 million tonnes, whereas the resources within abandoned deposits accounts for 7.8% of total resources (1,495.32 million tonnes) and increased by 5.43 million tonnes.
In 2017, the output of sands and gravel amounted to 186.30 million tonnes, increasing by 13.12 million tonnes (that is 7.6%) in relation to the previous year. The output grew in 12 out of 16 voivodeships. The output significantly increased in the regions where investments in the road building industry were carried out. The table below shows changes within the production in particular voivodeships in 2017 in comparison with 2016.
|
The output in comparison with 2016
|
Difference (thousand tonnes) |
Difference (%) |
| Total | 13,121 | 7.6 |
| Zachodniopomorskie | 8,058 | 75.8 |
| Lubelskie | 2,439 | 56.7 |
| Wielkopolskie | 2,086 | 16.7 |
| Małopolskie | 1,272 | 10.5 |
| Mazowieckie | 1,068 | 6.4 |
| Podlaskie | 698 | 3.5 |
| Kujawsko-Pomorskie | 642 | 12.5 |
| Łódzkie | 631 | 10.5 |
| Podkarpackie | 559 | 8.3 |
| Świętokrzyskie | 522 | 25.5 |
| Warmińsko-Mazurskie | 444 | 2.5 |
| Baltic Sea | −31 | −4.8 |
| Lubuskie | −257 | −4.3 |
| Opolskie | −299 | −3.9 |
| Śląskie | −925 | −8.8 |
| Dolnośląskie | −1,874 | −11.1 |
| Pomorskie | −1,912 | −10.8 |
Figure below shows changes in domestic resources and production of sand and gravel in Poland in the years 1989-2017.
Natural sand and gravel are also obtained during the exploitation of brown coal deposits. In 2017 the output of sand and gravel from non-documented deposits during the exploitation of Bełchatów-pole Szczerców deposit amounted to 340.78 thousand tonnes, whereas the output from Turów deposit amounted to 121.10 thousand tonnes.
Prepared by: Dariusz Brzeziński, Anna Kalinowska, Wojciech Miśkiewicz, Joanna Stawierej
2016
Two major groups of natural sand-gravel aggregates are differentiated: a coarse aggregate group, comprising gravels and sand-gravel mix, and that of fine aggregates – comprising sands. The sand deposits in Poland are usually evenly arranged and only southern voivodeships are characterized by their shortage. The course aggregates deposits – particularly marketable – occur unevenly and especially the central voivodeships are characterized by the deficiency.
The bulk of Polish natural aggregate deposits are of the Quaternary age. The share of deposits of the Pliocene, Miocene and Liassic age is subordinate.
The quality of a raw material (especially its homogeneity) depends largely on a genetic type of a given deposit. Among deposits of Quaternary age there are three genetic types: glacial, fluvioglacial and fluvial (river). They are characterized by a zonality of their occurrence.
In the southern Poland, in the Carpathian-Sudetic zone, the most common are deposits of the fluvial origin. In the Sudety Mts., the most common deposits are those of sandy-gravel higher terraces of the Pleistocene age, built mainly of detritus of sandstones and crystalline rocks. In turn, in the Carpathian region the raw material basis comprises mainly gravel and sandy gravel deposits occurring on flood-plain terraces as well as valley side terraces rising above flood plains. The Carpathian deposits are characterized by a predominance of material coming from a disintegration of flysch rocks, except for those of the Dunajec River valley, showing a fairly high contribution of crystalline rocks from the Tatry Mts.
In the northern and central Poland (Polish Lowlands), the most important are deposits of a glacial (accumulation platform of front moraine) and fluvioglacial (outwash plain and esker) origin and resulting from a river accumulation. Deposits from the northern part of that area are represented by gravel-sandy accumulations mainly comprising Scandinavian material – debris of crystalline rocks and limestones with admixture of quartz and sandstones. In the central and southern parts of this region, the deposits are mainly formed of sandy sediments with significant share of debris of local rocks.
According to the Regulation of the Minister of the Environment of the 1st of July 2015 sand deposit with sand content above 75% should be characterized by thickness not smaller than 2 m, the ratio of cover to deposit series not higher than 0.3 and content of grains of silt fraction below 10%, while sand, graveled-sand and sandy-gravel deposit with sand content below 75% should be characterized by thickness not smaller than 2 m, the ratio of cover to deposit series not higher than 1.0 and content of grains of silt fraction below 15%.
Sand and gravel deposits occurrence in Poland is presented on the map.
Table 1 shows resources and the current state of exploration and development of natural sand and gravel aggregates.
Anticipated economic resources of natural aggregates as of 31.12.2016 totaled 19,016.48 million tonnes. The resources increased by 376.91 million tonnes (2.02%) in relation to the previous year. The growth dynamism increased in comparison with the previous year when it was equal 1.52%.
Sand and gravel deposits are being documented within 4 subtypes: sand, sand and gravel, gravel, loamy sand. The resources of sands with sand content above 75% amounted to 8,258.06 million tonnes (increased by 320.48 million tonnes in comparison with 2015) from which 2,247.21 million tonnes are within exploited deposits. The resources of graveled-sands and sandy-gravel sands with sand content between 30% and 75% amounted to 9,792.04 million tonnes (decreased by 20.60 million tonnes). The resources of gravel (with sand content <30%) amounted to 937.46 million tonnes (increased by 77.16 million tonnes) and the resources of loamy sands 28.75 (decreased 0.07 million tonnes).
The resources increased due to:
- including in ‘The balance…’ 485 new deposits documented in 2016 with anticipated economic resources equal 539.99 million tonnes. The largest resources where documented within 53 deposits in Pomorskie Voivodeship with resources equal 79.19 million tonnes. The largest deposits are: Góra VI (8.80 million tonnes), Rozłazino VIII (7.75 million tonnes), Żelazno (5.89 million tonnes) and Kębłowo Nowowiejskie IV (5.72 million tonnes). Except of these, there were also 19 new deposits documented with the resources in the range of 1.1-4.6 million tonnes. The second largest, taking into account the resources amount, are 36 deposits documented in Kujawsko-Pomorskie Voivodeship with resources amounted to 57.37 million tonnes. The biggest are: Chrostkowo Nowe (29.72 million tonnes), Wrzosy I (8.60 million tonnes) and Konopat II (3.38 million tonnes). In Mazowieckie Voivodeship, there were 53.89 million tonnes of resources documented within 57 deposits i.a.: Trojanów (6.39 million tonnes), Rudno Jeziorowe VIII (4.51 million tonnes), Prosienica II/2 (4.22 million tonnes). Moreover, among the biggest deposits there are also Stróża Północ (12.94 million tonnes) located in Dolnosląskie Voivodeship and Sępólno Wielkie V (12.82 million tonnes) in Zachodniopomorskie Voivodeship. The least resources were documented in Świętokrzyskie Voivodeship (4.80 million tonnes within 6 deposits), Lubuskie Voivodeship (10.80 million tonnes within 9 deposits) and in Opolskie Voivodeship (13.60 million tonnes within 6 deposits). In 2016 there were also 7.42 million tonnes of anticipated sub-economic resources documented in Poland;
- the verifications and resources updating, resulting from: the enlargement of a deposit area or deepening of its range, resources updating due to the long-term exploitation, the change of resources utilization or resources settlement after new deposits allocation within already documented deposits. The largest increases were recorded in deposits: Żabi Róg (resources increase equal 6.89 million tonnes) and Kanigowo VII (6.17 million tonnes) in Warmińsko-Mazurskie Voivodeships; Ginawa (5.42 million tonnes) and Bielinek III-pole W (2.80 million tonnes) in Zachodniopomorskie Voivodeship; siedlakowice I (6.59 million tonnes) in Dolnośląskie Voivodeship; Biała Woda VIII (4.56 million tonnes) in Podlaskie Voivodeship; Skórowo Nowe (4.64 million tonnes), Linia II (3.60 million tonnes), Gostomie X (3.10 million tonnes) in Pomorskie Voivodeship; Kaszczor II (2.83 million tonnes) in Wielkopolskie Voivodeship; Wygoda (2.24 million tonnes) in Lubelskie Voivodeship; Guty-Bujno (2.54 million tonnes) in Mazowieckie Voivodeship. The resources decreases due to the new documentation with recalculated resources were recorded for i.a.: Łęgowo deposit (−8.88 million tonnes) in Warmińsko-Mazurskie Voivodeship, Brzegi (−7.26 million tonnes) in Małopolskie Voivodeship, Turze (−7.15 million tonnes) and Racibórz I-Zbiornik (−2.74 million tonnes) in Śląskie Voivodeship, Żelazna II (−5.46 million tonnes) in Opolskie Voivodeship, Stężyca (−5.13 million tonnes) in Lubuskie Voivodeship, Paniowice (−4.75 million tonnes) in Dolnośląskie Voivodeship, Rudno Jeziorowe (−3.54 million tonnes) in Mazowieckie Voivodeship, Dargocice (−3.35 million tonnes) in Zachodniopomorskie Voivodeship and Wierzbowo-Mareckie (−2.00 million tonnes) in Podlaskie Voivodeship;
- the balance of decreases and increases recorded in the new documentation with recalculated resources approved for already documented deposits and as a result of the current resources verification connected with the exploitation – about 66.5 million tonnes.
The resources decreased by:
- the output (173.18 million tonnes);
- crossing out 205 deposits from ‘The balance…’ with total resources equal about 56.56 million tonnes. The largest amount of resources were deleted from i.a.: Wymysłów II deposit (−4.00 million tonnes) in Świętokrzyskie Voivodeship, Stróża Dolna (−3.91 million tonnes) in Dolnośląskie Voivodeship, Templewo I (−4.23 million tonnes) and Nowa Niedrzwica KW (−3.25 million tonnes) in Lubuskie Voivodeship, Urbanice (−1.99 million tonnes) in Łódzkie Voivodeship, Telaki VII (−1.60 million tonnes) in Mazowieckie Voivodeship, Łętowice (−1.43 million tonnes) in Małopolskie Voivodeship, Bilwinki (−1.20 million tonnes) in Podlaskie Voivodeship. In other deposits there were resources of several thousands to about one milion tonnes deleted.
The table below shows changes within anticipated economic resources in particular voivodeships in 2016.
|
No.
|
Increase
|
(thousand tonnes)
|
No.
|
Decrease
|
(thousand tonnes)
|
|
|
1.
|
Dolnośląskie | 75,247 | 1. | Lubuskie | −14,901 | |
|
2.
|
Pomorskie | 71,648 | 2. | Śląskie | −4,421 | |
|
3.
|
Kujawsko-Pomorskie | 50,793 | 3. | Baltic Sea | −584 | |
|
4.
|
Wielkopolskie | 37,027 | ||||
|
5.
|
Warmińsko-Mazurskie | 36,221 | ||||
|
6.
|
Zachodniopomorskie | 35,762 | ||||
|
7.
|
Mazowieckie | 27,631 | ||||
|
8.
|
Lubelskie | 13,744 | ||||
|
9.
|
Łódzkie | 12,644 | ||||
|
10.
|
Podkarpackie | 12,302 | ||||
|
11.
|
Podlaskie | 12,145 | ||||
|
12.
|
Małopolskie | 7,599 | ||||
|
13.
|
Opolskie | 4,065 | ||||
|
14.
|
Świętokrzyskie | 9 | ||||
|
|
Total increase | 396,837 | Total decrease | −19,906 |
The most deposits are located in Mazowieckie (1,308), Wielkopolskie (1,162), Lubelskie (907), Łódzkie (847) and Warmińsko-Mazurskie (758) Voivodeships.
Voivodeships with the biggest resources are: Dolnośląskie (2,288 million tonnes), Małopolskie (1,854 million tonnes), Podlaskie (1,536 million tonnes), Opolskie (1,398 million tonnes), Podkarpackie (1,295 million tonnes) and Mazowieckie (1,262 million tonnes).
Deposits of sand and gravel contain resources from several thousands to more than 380 million tonnes. The percentage contribution of resources within particular ranges is presented below:
|
(million tonnes)
|
Resources (million tonnes)
|
Percentage contribution
|
|
0.0-0.5
|
1,020 | 5.36% |
|
0.5-1.0
|
777 | 4.09% |
|
1.0-5.0
|
3,674 | 19.32% |
|
5.0-10.0
|
2,340 | 12.31% |
|
10.0-50.0
|
6,162 | 32.40% |
|
50.0-400.0
|
5,043 | 26.52% |
Resources within deposits covered by a detailed exploration (A, B, C1) amounted to 11,188.71 million tonnes and accounts for 59% of the total anticipated economic resources, with resources within deposits covered by a preliminary exploration (C2 and D categories) states for 41%. Resources within exploited deposits amounted to 5,899.21 million tonnes and increased by 429.16 million tonnes in comparison with 2015 (they account for 31% of the total anticipated economic resources), resources within non-exploited deposits amounted to 11,698.93 million tonnes (62% of total resources) and decreased by 41.67 million tonnes, whereas the resources within abandoned deposits accounts for 7.5% of total resources (1,418.33 million tonnes) and decreased by 10.6 million tonnes.
In 2016, the production of natural sands and gravel amounted to 173.18 million tonnes, increasing by 5.25 million tonnes (that is 3.1%) in relation to the previous year. The output grew in 8 out of 16 voivodeships. The production increased in the regions where investments in road building industry were carried out. The table below shows changes within the production in particular voivodeships in 2016 in comparison with 2015 (thousand tonnes).
|
The output in comparison with 2015
|
Difference (thousand tonnes) |
Difference (%) |
| TOTAL | 5,247 | 3.1 |
| Mazowieckie | 4,514 | 37.5 |
| Dolnośląskie | 2,552 | 17.8 |
| Pomorskie | 2,453 | 16.0 |
| Warmińsko-Mazurskie | 1,526 | 9.5 |
| Śląskie | 1,031 | 10.8 |
| Wielkopolskie | 988 | 8.6 |
| Lubuskie | 830 | 16.2 |
| Opolskie | 575 | 8.1 |
| Baltic Sea | 165 | 34.0 |
| Świętokrzyskie | −137 | −6.3 |
| Lubelskie | −197 | −4.4 |
| Kujawsko-Pomorskie | −214 | −4.0 |
| Zachodniopomorskie | −362 | −3.3 |
| Podlaskie | −1,172 | −5.5 |
| Małopolskie | −1,709 | −12.4 |
| Podkarpackie | −2,239 | −24.9 |
| Łódzkie | −3,357 | −35.9 |
Figure below shows changes in domestic resources and production of sand and gravel in Poland in the years 1989-2016.
Natural sand and gravel are also obtained during the exploitation of brown coal deposits. In 2016 the output of sand and sand and gravel from non-documented deposits during the exploitation of Bełchatów-pole Szczerców deposit amounted to 8.46 thousand tonnes.
Prepared by: Dariusz Brzeziński, Anna Kalinowska, Wojciech Miśkiewicz, Joanna Stawierej
2015
Two major groups of natural sand-gravel aggregates are differentiated: coarse aggregate group, comprising gravels and sand-gravel mix, and that of fine aggregates – comprising sands. Natural aggregates are used mainly in the building (concrete fill) and road construction (embankment and highway fill and road surfacing).
The demand for natural coarse aggregates is the largest, especially as distribution of their resources is far from uniform. The resources of natural coarse aggregates are generally small in central parts of the country, not covering the local demand.
The bulk of Polish natural aggregate deposits are of the Quaternary age. The share of deposits of the Pliocene, Miocene and Liassic age is subordinate.
The quality of raw material (especially its homogenity) depends largely on genetic type of a given deposit. Deposits of fluvial origin clearly predominate in the Carpathian-Sudetic zone (southern Poland). In the Sudety Mts, the most common deposits are those of sandy-gravel higher terraces of the Pleistocene age, built mainly of detritus of sandstones and crystalline rocks. In turn, in the Carpathian region the raw material basis mainly comprises gravel and sandy gravel deposits occurring on flood-plain terraces as well as valley side terraces rising above flood plains. The Carpathian deposits are characterized by predominance of material coming from disintegration of flysch rocks, except for those of the Dunajec River valley, showing fairly high contribution of crystalline rocks from the Tatry Mts.
In northern and central Poland (Polish Lowlands region), the most important deposits are of glacial (accumulation platform of front moraine) and fluvioglacial (outwash plain and esker) origin and resulting from river accumulation. Deposits from northern part of that area represent gravel-sandy accumulations mainly comprising Scandinavian material – debris of crystalline rocks and limestones with admixture of quartz and sandstones. In central and southern parts of this region, the deposits are mainly formed of sandy sediments with significant share of debris of local rocks.
According to the Regulation of the Minister of the Environment of the 1st of July 2015 sand deposit with sand content above 75% should be characterized by thickness not smaller than 2 m, the ratio of cover to deposit series not higher than 0.3 and content of grains of silt fraction below 10%, while sand, graveled-sand and sandy-gravel deposit with sand content below 75% should be characterized by thickness not smaller than 2 m, the ratio of cover to deposit series not higher than 1.0 and content of grains of silt fraction below 15%.
Sand and gravel deposits occurrence in Poland is presented on the map.
Table 1 shows resources and the current state of exploration and development of natural sand and gravel aggregates.
Anticipated economic resources of natural aggregates as of 31.12.2015 totaled 18,639.57 million tonnes. The resources increased by 278.67 million tonnes (1.52%) in relation to the previous year.
Sand and gravel deposits are being documented within 4 subtypes: sand, sand and gravel, gravel, loamy sand. The resources of sands with sand content above 75% amounted to 7,937.6 million tonnes (increased by 310 million tonnes in comparison with the previous year) from which 2,121.3 million tonnes are within exploited deposits. The resources of graveled-sands and sandy-gravel sands with sand content between 25 and 75% amounted to 9,812.6 million tonnes (increased by 42.1 million tonnes). The resources of gravel (with sand content <25%) amounted to 860.3 million tonnes (decreased by 77.2 million tonnes) and the resources of loamy sands 28.8 (increased 3.6 million tonnes).
The resources increased due to:
- including in ‘The balance…’ 450 new deposits documented in 2015 with anticipated economic resources equal 645.78 million tonnes. The largest resources where documented within 26 deposits in Podlaskie Voivodeship with resources equal 151.46 million tonnes. The largest deposits are: Bród Nowy VII (66.52 million tonnes), Kuków-Folwark XI (48.87 million tonnes) and Wąsocz 8 (22.78 million tonnes). The second largest, taking into account resources, are 44 deposits documented in Pomorskie Voivodeship with resources amounted to 138.02 million tonnes. The biggest are: Potęgowo II (17.77 million tonnes), Waplewo Wielkie IV (17.58 million tonnes), Nowy Barkoczyn IV (15.21 million tonnes) and Tuchom I (10 million tonnes). Moreover, there were also 12 new deposits documented within the rnage of 2-10 million tonnes of resources. In Zachodniopomorskie Voivodeship, there were 81.61 million tonnes of resources documented within 23 deposits, i.a. Zarańsko (44.76 million tonnes) and Sowno (10.55 million tonnes). In Warmińsko-Mazurskie Voivodeship the new documented resources amounted to 56.04 million tonnes (42 deposits), including the largest ones – Botowo V (18.07 million tonnes) and Łęgowo VII (11.7 million tonnes). The largest new deposit in Małopolskie Voivodeship is Przyborów-Żwiry (9.72 million tonnes) and in Podkarpackie Voivodeship – Gniewczyna Tryniecka 2 (6.17 million tonnes) and Gniewczyna Tryniecka 3 (5.19 million tonnes). The least resources were documented in Świętokrzyskie and Opolskie Voivodeships – 1.36 million tonnes within 3 deposits and 1.21 million tonnes within 3 deposits respectively;
- the verifications of resources due to the changes of deposits boundaries, updating of resources due to the long exploitation, the change of utilization or resources accounting after allocating of new deposits. The largest increases were recorded in: Wola Radłowska Grądy I (resources increase equal 26.81 million tonnes) in Małopolskie Voivodeship, Walkowice MD (17.52 million tonnes) in Wielkopolskie Voivodeship, Turze 1 (8.55 million tonnes) in Śląskie Voivodeship, Głębocko I-1 (7.73 million tonnes) in Opolskie Voivodeship, Kozin III (6.12 million tonnes) in Pomorskie Voivodeship, Racewo (6.27 million tonnes) in Podlaskie Voivodeship, Dzwonek (6.23 million tonnes) and Sitki I (3.7 million tonnes) in Mazowieckie Voivodeship, Jezierzyce Wielkie I (5.39 million tonnes) in Dolnośląskie Voivodeship and Ognica (3.17 million tonnes) in Zachodniopomorskie Voivodeship. The resources decreases due to the new documentation with recalculated resources were recorded for i.a. Borowiec (−25.45 million tonnes) and Potęgowo (−20.64 million tonnes) deposits in Pomorskie Voivodeship, Deszczno-Łagodzin (−32.16 million tonnes) deposit in Lubuskie Voivodeship, Szczytniki – pola A, B, C, D (−6.24 million tonnes) deposit in Dolnośląskie Voivodeship, Wąsosz 3 – p.A-D (−3.43 million tonnes) and Wąsosz 2 (−4.74 million tonnes) deposits in Podlaskie Voivodeship and Niemce-Rokitno II-SW (−2.68 million tonnes) deposit in Lubelskie Voivodeship.
The resources decreased by:
- the output (167.93 million tonnes);
- crossing out 255 deposits from ‘The balance…’ with total resources equal 117.47 million tonnes. The largest amount of resources were deleted from i.a. Winna Góra (−26.87 million tonnes) and Pobiel (−3.64 million tonnes) deposits in Dolnośląskie Voivodeship, Wola Radłowska Grądy II-Brzeźnica (−26.88 million tonnes) deposit in Małopolskie Voivodeship, Głębocko II (−5.18 million tonnes) deposit in Opolskie Voivodeship, Racewo II (−7.86 million tonnes) deposit in Podlaskie Voivodeship, Wietrznica (−5 million tonnes) deposit in Pomorskie Voivodeship, Nowy Dwór I (−4.68 million tonnes) deposit in Śląskie Voivodeship and Biały Dwór (−3 million tonnes) deposit in Zachodniopomorskie Voivodeship. In other deposits there were resources of several thousand to abort one million tonnes deleted;
- approving new documentations with reassessed resources (−82.0 million tonnes).
The table below shows changes within anticipated economic resources in particular voivodeships in 2015.
|
No.
|
Increase
|
(thousand tonnes)
|
No.
|
Decrease
|
(thousand tonnes)
|
|
|
1.
|
Podlaskie | 112,638 | 1. | Dolnośląskie | −79,501 | |
|
2.
|
Pomorskie | 76,220 | 2. | Lubuskie | −25,026 | |
|
3.
|
Zachodniopomorskie | 72,886 | 3. | Opolskie | −10,423 | |
|
4.
|
Warmińsko-Mazurskie | 42,968 | 4. | Łódzkie | −3,207 | |
|
5.
|
Wielkopolskie | 31,584 | 5. | Małopolskie | −3,509 | |
|
6.
|
Mazowieckie | 24,063 | 6. | Baltic Sea | −390 | |
|
7.
|
Lubelskie | 14,294 | ||||
|
8.
|
Kujawsko-Pomorskie | 10,659 | ||||
|
9.
|
Śląskie | 10,054 | ||||
|
10.
|
Podkarpackie | 5,269 | ||||
|
11.
|
Świętokrzyskie | 87 |
The most deposits are located in Mazowieckie (1,274), Wielkopolskie (1,131), Lubelskie (893), Łódzkie (847) and Podkarpackie (746) Voivodeships.
Voivodeships with the biggest resources are: Dolnośląskie (2,212 million tonnes), Małopolskie (1,846 million tonnes), Podlaskie (1,524 million tonnes), Opolskie (1,393 million tonnes), Podkarpackie (1,283 million tonnes) and Mazowieckie (1,235 million tonnes).
Resources within deposits covered by detailed exploration (A, B, C1 categories) amounted to 10,813.38 million tonnes and accounts for 58% of the total anticipated economic resources, with resources within deposits covered by preliminary exploration (C2 and D categories) states for 42%. Resources within exploited deposits amounted to 5,470.05 million tonnes and decreased by 53.7 million tonnes in comparison with 2014 (they account for 29.35% of the total anticipated economic resources), resources within non-exploited deposits amounted to 11,740.60 million tonnes (63% of total resources) and increased by 194 million tonnes, whereas the resources within abandoned deposits accounts for 7.7% of total resources (1,425.89 million tonnes) and increased by 135.4 million tonnes.
In 2015, production of natural sands and gravel amounted to 167.93 million tonnes, increasing by 21.4 million tonnes (that is 14.6%) in relation to the previous year (table 2). After three years of decreasing, the output grew in 14 out of 16 Voivodeships. It was due to the growing investments in road building industry. The table below shows changes within production in particular voivodeships in 2015 (thousand tonnes).
|
Changes in production in comparison with 2014
|
(thousand tonnes) | (%) |
| Total | 21,402 | 14.6 |
| Pomorskie | 5,810 | 61.0 |
| Wielkopolskie | 2,734 | 31.1 |
| Warmińsko-Mazurskie | 2,227 | 16.1 |
| Łódzkie | 2,058 | 28.2 |
| Dolnośląskie | 1,950 | 15.7 |
| Śląskie | 1,673 | 21.3 |
| Lubuskie | 1,441 | 39.2 |
| Podlaskie | 1,267 | 6.3 |
| Małopolskie | 856 | 6.6 |
| Zachodniopomorskie | 802 | 7.9 |
| Podkarpackie | 485 | 5.7 |
| Kujawsko-Pomorskie | 407 | 8.3 |
| Opolskie | 283 | 4.2 |
| Świętokrzyskie | 233 | 11.9 |
| Mazowieckie | −125 | −1.0 |
| Baltic Sea | −287 | −37.2 |
| Lubelskie | −412 | −8.4 |
Figure below shows changes in domestic resources and production of sand and gravel in Poland in the years 1989-2015.
Natural sand and gravel are also obtained during the exploitation of brown coal. In 2015 the output of sand and gravel from Bełchatów deposit amounted to 8.6 thousand tonnes.
Prepared by: Wojciech Miśkiewicz, Dariusz Brzeziński, Joanna Stawierej, Agnieszka Wałkuska
2014
Two major groups of natural sand-gravel aggregates are differentiated: coarse aggregate group, comprising gravels and sand-gravel mix, and that of fine aggregates – comprising sands. Natural aggregates are used mainly in the building (concrete fill) and road construction (embankment and highway fill and road surfacing).
The demand for natural coarse aggregates is the largest, especially as distribution of their resources is far from uniform. The resources of natural coarse aggregates are generally small in central parts of the country, not covering the local demand.
The bulk of Polish natural aggregate deposits are of the Quaternary age. The share of deposits of the Pliocene, Miocene and Liassic age is subordinate.
The quality of raw material (especially its homogenity) depends largely on genetic type of a given deposit. Deposits of fluvial origin clearly predominate in the Carpathian-Sudetic zone (southern Poland). In the Sudety Mts, the most common deposits are those of sandy-gravel higher terraces of the Pleistocene age, built mainly of detritus of sandstones and crystalline rocks. In turn, in the Carpathian region the raw material basis mainly comprises gravel and sandy gravel deposits occurring on flood-plain terraces as well as valley side terraces rising above flood plains. The Carpathian deposits are characterized by predominance of material coming from disintegration of flysch rocks, except for those of the Dunajec River valley, showing fairly high contribution of crystalline rocks from the Tatry Mts.
In northern and central Poland (Polish Lowlands region), the most important deposits are of glacial (accumulation platform of front moraine) and fluvioglacial (outwash plain and esker) origin and resulting from river accumulation. Deposits from northern part of that area represent gravel-sandy accumulations mainly comprising Scandinavian material – debris of crystalline rocks and limestones with admixture of quartz and sandstones. In central and southern parts of this region, the deposits are mainly formed of sandy sediments with significant share of debris of local rocks.
According to the Regulation of the Minister of the Environment of the 22nd of December 2011 (number of Polish act: Dz. U. Nr 291, poz. 1712.), sand deposits should be charcterized by content of grains of silt fraction below 10%, thickness not smaller than 2 m and the ratio of cover to deposit series not higher than 0.3 while sand and gravel deposits should be characterized by content of grains of silt fraction below 15%, thickness not smaller than 2 m and the ratio of cover to deposit series not higher than 1.0.
Sand and gravel deposits occurence in Poland is presented on the map.
Table 1 shows resources and the current state of exploration and development of natural sand and gravel aggregates.
Anticipated economic resources of natural aggregates totaled 18,360.90 million tonnes as of 31.12.2014. They increased by 388.40 million tonnes (2.1%) in relation to the previous year.
Sand and gravel deposits are being documented within 4 subtypes: sand, sand and gravel, gravel, loamy sand. The resources of sands with sand content above 75% amounted to 7,627.4 million tonnes from which 2,012.2 million tonnes are within exploited deposits; the resources of graveled-sands and sandy-gravel sands with sand content below 75% amounted to 9,770.5 million tonnes (3,202.3 million tonnes within exploited deposits); the resources of gravel amounted to 937.5 million tonnes (286.9 million tonnes within exploited deposits); the resources of loamy sands amounted to 25.3 million tonnes (22.3 million tonnes within exploited deposits).
The resources increased due to:
- 467 new deposits documented in 2014 with anticipated economic resources amounted to 622.7 million tonnes. The largest resources were documented in Podlaskie Voivodeship (141.9 million tonnes within 34 new deposits), Wielkopolskie Voivodeship (74.2 million tonnes within 67 new deposits) and Dolnośląskie Voivodeship (60.8 million tonnes within 21 new deposits).
- the verifications of resources due to the changes of deposits boundaries and resources verifications, mainly in: Sępólno Wielkie deposit (resources increase equal 10.6 million tonnes), Sępólno Wielkie II (+5.8 million tonnes) and Ostrowąs (+5.6 million tonnes) in Zachodniopomorskie Voivodeship; Kazanice IV deposit (+4.2 million tonnes) in Warmińsko-Mazurskie Voivodeship; Brzeziny II (+6.3 million tonnes) in Świętokrzyskie Voivodeship; Bolimów III (+3.5 million tonnes) in Łódzkie Voivodeship; Brzeziny I (+3.3 million tonnes) in Lubelskie Voivodeship; Wola Batorska (+3.1 million tonnes) in Małopolskie Voivodeship.
The resources decreased by:
- the output (−146.5 million tonnes)
- crossing out 271 deposits from ‘The balance…’ (−65.1 million tonnes)
- approving new documentations with reassessed resources (−23.8 million tonnes)
The table below shows changes within anticipated economic resources in particular voivodeships in 2014 (thousand tonnes).
| increase: | decrease: | |||||
|
1.
|
podlaskie | 118,929 | 1. | opolskie | −6,470 | |
|
2.
|
zachodniopomorskie | 58,180 | 2. | małopolskie | −4,631 | |
|
3.
|
wielkopolskie | 57,450 | 3. | Baltic Sea | −773 | |
|
4.
|
mazowieckie | 42,056 | 4. | podkarpackie | −73 | |
|
5.
|
dolnośląskie | 27,172 | ||||
|
6.
|
kujawsko-pomorskie | 22,534 | ||||
|
7.
|
pomorskie | 19,293 | ||||
|
8.
|
łódzkie | 17,396 | ||||
|
9.
|
warmińsko-mazurskie | 16,696 | ||||
|
10.
|
śląskie | 8,881 | ||||
|
11.
|
lubuskie | 5,221 | ||||
|
12.
|
świętokrzyskie | 4,226 | ||||
|
13.
|
lubelskie | 2,311 |
The most deposits are located in Mazowieckie (1,241), Wielkopolskie (1,109), Lubelskie (877), Łódzkie (854) and Podkarpackie (756) Voivodeship.
Voivodeship with the biggest resources are: Dolnośląskie (2,292 million tonnes), Małopolskie (1,849 million tonnes), Podlaskie (1,411 million tonnes), Opolskie (1,404 million tonnes), Podkarpackie (1,277 million tonnes) and Mazowieckie (1,211 million tonnes).
Resources within deposits covered by detailed exploration (A, B, C1) amounted to 10,437.8 million tonnes and accounts for 56.8% of the total anticipated economic resources, with resources within deposits covered by preliminary exploration (C2 and D) states for 43.2%. Resources within exploited deposits amounted to 5,523.8 million tonnes (30.1% of the total anticipated economic resources), resources within non-exploited deposits amounted to 11,546.6 million tonnes (62.9%) while resources within abandoned deposits accounts for 7.0% of total rerources (1,290.5 million tonnes).
In 2014, production of natural sands and gravel amounted to 146.5 million tonnes, decreasing by 26.7 million tonnes that is 15.4% in relation to the previous year. The production decreased in 10 voivodeships. The table below shows changes within production in particular voivodeships in 2013 (thousand tonnes).
| Changes in production in comparison with 2013 (thousand tonnes) | % | |
| dolnośląskie | 2,371 | 23,7 |
| śląskie | 2,178 | 38,3 |
| małopolskie | 1,367 | 11,8 |
| warmińsko-mazurskie | 1,222 | 9,7 |
| Baltic Sea | 482 | 166,2 |
| zachodniopomorskie | 256 | 2,6 |
| świętokrzyskie | 34 | 1,8 |
| opolskie | −2 | −0,03 |
| mazowieckie | −473 | −3,7 |
| kujawsko-pomorskie | −814 | −14,2 |
| podlaskie | −1,023 | −4,9 |
| lubelskie | −1,514 | −23,6 |
| pomorskie | −1,533 | −13,9 |
| lubuskie | −1,840 | −33,3 |
| wielkopolskie | −2,133 | −19,5 |
| podkarpackie | −8,594 | −50,3 |
| łódzkie | −16,724 | −69,6 |
| Total | −26,740 | −15,4 |
Figure below shows changes in domestic resources and production of sand and gravel in Poland in the years 1989-2014.
Natural sand and gravel are also obtained during the exploitation of Brown coal. In 2014 from Bełchatów deposit the output of sand and gravel amounted to 19.79 thousand tonnes.
Prepared by: Wojciech Miśkiewicz, Dariusz Brzeziński, Janina Dyląg, Marzena Kozera, Joanna Stawierej, Agnieszka Wałkuska
2013
Two major groups of natural sand-gravel aggregates are differentiated: coarse aggregate group, comprising gravels and sand-gravel mix, and that of fine aggregates – comprising sands. Natural aggregates are used mainly in the building (concrete fill) and road construction (embankment and highway fill and road surfacing).
The demand for natural coarse aggregates is the largest, especially as distribution of their resources is far from uniform. The resources of natural coarse aggregates are generally small in central parts of the country, not covering the local demand.
The bulk of Polish natural aggregate deposits are of the Quaternary age. The share of deposits of the Pliocene, Miocene and Liassic age is subordinate.
The quality of raw material (especially its homogenity) depends largely on genetic type of a given deposit. Deposits of fluvial origin clearly predominate in the Carpathian-Sudetic zone (southern Poland). In the Sudety Mts, the most common deposits are those of sandy-gravel higher terraces of the Pleistocene age, built mainly of detritus of sandstones and crystalline rocks. In turn, in the Carpathian region the raw material basis mainly comprises gravel and sandy gravel deposits occurring on flood-plain terraces as well as valley side terraces rising above flood plains. The Carpathian deposits are characterized by predominance of material coming from disintegration of flysch rocks, except for those of the Dunajec River valley, showing fairly high contribution of crystalline rocks from the Tatry Mts.
In northern and central Poland (Polish Lowlands region), the most important deposits are of glacial (accumulation platform of front moraine) and fluvioglacial (outwash plain and esker) origin and resulting from river accumulation. Deposits from northern part of that area represent gravel-sandy accumulations mainly comprising Scandinavian material – debris of crystalline rocks and limestones with admixture of quartz and sandstones. In central and southern parts of this region, the deposits are mainly formed of sandy sediments with significant share of debris of local rocks.
According to the Regulation of the Minister of the Environment of the 22nd of December 2011 (number of Polish act: Dz. U. Nr 291, poz. 1712.), sand deposits should be charcterized by content of grains of silt fraction below 10%, thickness not smaller than 2 m and the ratio of cover to deposit series not higher than 0.3 while sand and gravel deposits should be characterized by content of grains of silt fraction below 15%, thickness not smaller than 2 m and the ratio of cover to deposit series not higher than 1.0.
Sand and gravel deposits occurence in Poland is presented on the map.
Table 1 shows resources and the current state of exploration and development of natural sand and gravel aggregates.
Anticipated economic resources of natural aggregates totaled 17,972.50 million tonnes at the end of 2013. This means an increase by 237.36 million tonnes in relation to the previous year. That was mainly due to 464 new deposits documented in 2013 with anticipated economic resources amounted to 484.6 million tonnes. The largest resources were documented in Warmińsko-Mazurskie Voivodeship (84.0 million tonnes within 43 new deposits), Dolnośląskie Voivodeship (80.3 million tonnes within 18 new deposits) and Pomorskie Voivodeship (72.8 million tonnes within 43 new deposits). There were also verifications of resources due to the changes of deposits boundaries and resources verifications, mainly in Długopole I deposit (resources increase equal 6.7 million tonnes), Kotlarnia pole Północne deposit (6.6 million tonnes), Dołha deposit (5.8 million tonnes) and Golice deposit (5.6 million tonnes).
There were 258 deposits crossed out of ‘The balance…’ with anticipated economic resources amounted to 46.5 million tonnes.
The table below shows changes within anticipated economic resources in particular voivodeships in 2013 (thousand tonnes).
| increase: | decrease: | |||||
|
1.
|
woj. dolnośląskie | 69,354 | 1. | woj. podkarpackie | −14,313 | |
|
2.
|
woj. warmińsko-mazurskie | 62,129 | 2. | woj. lubuskie | −6,864 | |
|
3.
|
woj. pomorskie | 52,629 | 3. | woj. małopolskie | −4,554 | |
|
4.
|
woj. kujawsko-pomorskie | 15,697 | 4. | Bałtyk | −298 | |
|
5.
|
woj. wielkopolskie | 15,107 | ||||
|
6.
|
woj. świętokrzyskie | 11,616 | ||||
|
7.
|
woj. lubelskie | 11,505 | ||||
|
8.
|
woj. zachodniopomorskie | 7,792 | ||||
|
9.
|
woj. podlaskie | 7,580 | ||||
|
10.
|
woj. łódzkie | 5,273 | ||||
|
11.
|
woj. mazowieckie | 3,575 | ||||
|
12.
|
woj. śląskie | 583 | ||||
|
13.
|
woj. opolskie | 548 | ||||
|
|
Total increase (+) | Total decrease (−) |
The most deposits are located in Mazowieckie (1,222), Wielkopolskie (1,061), Lubelskie (862), Łódzkie (833) and Podkarpackie (774) Voivodeship.
Resources within deposits covered by detailed exploration (A, B, C1) amounted to 10,005.1 million tonnes and accounts for 55.7% of the total anticipated economic resources, with resources within deposits covered by preliminary exploration (C2) states for 44.3%. Resources within exploited deposits amounted to 5,455.8 million tonnes (30.4% of the total anticipated economic resources) while resources within abandoned deposits accounts for 7.0% of total rerources (1,262.7 million tonnes).
Economic resources amounted to 3,614.4 million tonnes and increased by 118.22 million tonnes in comparison with the previous year. The table below shows changes within economic resources in particular voivodeship in 2013 (thousand tonnes).
| increase: | decrease: | |||||
|
1.
|
woj. lubuskie | 25,202 | 1. | woj. małopolskie | −12,814 | |
|
2.
|
woj. zachodniopomorskie | 19,825 | 2. | woj. opolskie | −12,089 | |
|
3.
|
woj. łódzkie | 16,470 | 3. | Bałtyk | −299 | |
|
4.
|
woj. dolnośląskie | 14,680 | 4. | woj. mazowieckie | −176 | |
|
5.
|
woj. pomorskie | 14,226 | ||||
|
6.
|
woj. lubelskie | 13,389 | ||||
|
7.
|
woj. podlaskie | 11,993 | ||||
|
8.
|
woj. warmińsko-mazurskie | 10,636 | ||||
|
9.
|
woj. podkarpackie | 5,605 | ||||
|
10.
|
woj. śląskie | 5,498 | ||||
|
11.
|
woj. świętokrzyskie | 3,917 | ||||
|
12.
|
woj. wielkopolskie | 1,361 | ||||
|
13.
|
woj. kujawsko-pomorskie | 791 | ||||
|
|
Total increase (+) | Total decrease (−) |
In 2013, production of natural sands and gravel amounted to 173.3 million tonnes, decreasing by 11.5 million tonnes that is 6.2% less in relation to the previous year. The production decreased in most of the 16 voivodeships. The table below shows changes within production in particular voivodeships in 2013 (thousand tonnes).
| Decrease of production in compariosn with 2012 (thousand tonnes) |
% | |
| podlaskie | 6,530 | 45.1 |
| łódzkie | 2,260 | 10.4 |
| kujawsko-pomorskie | 900 | 18.6 |
| opolskie | 206 | 3.1 |
| zachodniopomorskie | 101 | 1.0 |
| Baltic Sea | 11 | 3.9 |
| śląskie | −515 | −8.3 |
| świętokrzyskie | −722 | −27.3 |
| pomorskie | −768 | −6.5 |
| lubelskie | −783 | −10.9 |
| lubuskie | −786 | −12.5 |
| warmińsko-mazurskie | −864 | −6.4 |
| wielkopolskie | −913 | −7.7 |
| mazowieckie | −2,837 | −18.3 |
| małopolskie | −3,660 | −24.0 |
| dolnośląskie | −3,879 | −27.9 |
| podkarpackie | −5,738 | −25.1 |
| Total | −11,457 | −6.2 |
Figure below shows changes in domestic resources and production of sand and gravel in Poland in the years 1989-2013.
Natural sand and gravel are also obtained during the exploitation of brown coal. In 2013 the output of sand and gravel from Bełchatów deposit amounted to 25.89 thousand tonnes.
Prepared by: Wojciech Miśkiewicz, Dariusz Brzeziński, Janina Dyląg, Marzena Kozera
2012
Two major groups of natural sand-gravel aggregates are differentiated: coarse aggregate group, comprising gravels and sand-gravel mix, and that of fine aggregates – comprising sands. Natural aggregates are used mainly in the building (concrete fill) and road construction (embankment and highway fill and road surfacing).
The demand for natural coarse aggregates is the largest, especially as distribution of their resources is far from uniform. The resources of natural coarse aggregates are generally small in central parts of the country, not covering the local demand.
The bulk of Polish natural aggregate deposits are of the Quaternary age. The share of deposits of the Pliocene, Miocene and Liassic age is subordinate.
The quality of raw material (especially its homogeneity) depends largely on genetic type of a given deposit. Deposits of fluvial origin clearly predominate in the Carpathian-Sudetic zone (southern Poland). In the Sudety Mts, the most common deposits are those of sandy-gravel higher terraces of the Pleistocene age, built mainly of detritus of sandstones and crystalline rocks. In turn, in the Carpathian region the raw material basis mainly comprises gravel and sandy gravel deposits occurring on flood-plain terraces as well as valley side terraces rising above flood plains. The Carpathian deposits are characterized by predominance of material coming from disintegration of flysch rocks, except for those of the Dunajec River valley, showing fairly high contribution of crystalline rocks from the Tatry Mts.
In northern and central Poland (Polish Lowlands region), the most important deposits are of glacial (accumulation platform of front moraine) and fluvioglacial (outwash plain and esker) origin and resulting from river accumulation. Deposits from northern part of that area represent gravel-sandy accumulations mainly comprising Scandinavian material – debris of crystalline rocks and limestones with admixture of quartz and sandstones. In central and southern parts of this region, the deposits are mainly formed of sandy sediments with significant share of debris of local rocks.
According to the Regulation of the Minister of the Environment of the 22nd of December 2011 (number of Polish act: Dz. U. Nr 291, poz. 1712.), sand and gravel deposits should be characterized by content of grains of silt fraction below 15%, thickness not smaller than 2 m and the ratio of cover to deposit series not higher than 1.0.
Sand and gravel deposits occurence in Poland is presented on the map.
Table 1 shows resources and the current state of exploration and development of natural sand and gravel aggregates.
Anticipated economic resources of natural aggregates totaled 17,735.14 million tonnes at the end of 2012. This means an increase by 502.6 million tonnes in relation to the previous year. That was mainly due to 645 new deposits documented in 2012 with anticipated economic resources amounted to 641.9 million tonnes. The largest resources were documented in Dolnośląskie Voivodeship (124.4 million tonnes within 37 new deposits), Łódzkie Voivodeship (101.6 million tonnes within 124 new deposits) and Pomorskie Voivodeship (78 million tonnes within 41 new deposits).
There were 222 deposits crossed out of ‘The balance…’ with anticipated economic resources amounted to 41.2 million tonnes.
The table below shows changes within anticipated economic resources in particular voivodeships in 2012 (thousand tonnes).
| increase: | decrease: | |||||
|
1.
|
woj. łódzkie |
121,200
|
1.
|
woj. opolskie |
−10,582
|
|
|
2.
|
woj. dolnośląskie |
101,647
|
2.
|
woj. małopolskie |
−8,071
|
|
|
3.
|
woj. mazowieckie |
54,636
|
Baltic Sea |
−279
|
||
|
4.
|
woj. pomorskie |
53,797
|
|
|||
|
5.
|
woj. wielkopolskie |
45,272
|
|
|||
|
6.
|
woj. podlaskie |
32,616
|
|
|||
|
7.
|
woj. warmińsko-mazurskie |
26,889
|
|
|||
|
8.
|
woj. podkarpackie |
23,982
|
|
|||
|
9.
|
woj. lubelskie |
18,756
|
|
|||
|
10.
|
woj. zachodniopomorskie |
16,127
|
|
|||
|
11.
|
woj. śląskie |
9,933
|
|
|||
|
12.
|
woj. lubuskie |
8,415
|
|
|||
|
13.
|
woj. świętokrzyskie |
7,844
|
|
|||
|
14.
|
woj. kujawsko-pomorskie |
403
|
|
|||
|
15.
|
woj. łódzkie |
124,200
|
|
|||
|
|
Total increase (+) |
521,517
|
Total decrease (−) |
−18,932
|
The most deposits are located in Mazowieckie (1,198), Wielkopolskie (1,031), Lubelskie (840), Łódzkie (804) and Podkarpackie (766) Voivodeship.
Resources within deposits covered by detailed exploration (A, B, C1) amounted to 9,735.38 million tonnes and accounts for 54.9% of the total anticipated economic resources, with resources within deposits covered by preliminary exploration (C2) states for 45.1%. Resources within exploited deposits amounted to 5,355.1 million tonnes (30.2% of the total anticipated economic resources).
Economic resources amounted to 3,496.21 million tonnes and increased by 465.5 million tonnes in comparison with the previous year.
In 2012, production of natural sands and gravel amounted to 184.7 million tonnes, decreasing by 64 million tonnes that is 25.7% in relation to the previous year. The production decreased in all of the 16 voivodeships. The table below shows changes within production in particular voivodeships in 2012 (thousand tonnes).
| Decrease of production thousand tonnes) | % | |
| woj. mazowieckie |
−13,269
|
−46.1
|
| woj. kujawsko-pomorskie |
−9,911
|
−67.2
|
| woj. dolnośląskie |
−7,771
|
−35.9
|
| woj. warmińsko-mazurskie |
−6,215
|
−31.6
|
| woj. podlaskie |
−6,021
|
−29.4
|
| woj. małopolskie |
−5,741
|
−27.4
|
| woj. lubuskie |
−2,785
|
−30.6
|
| woj. zachodniopomorskie |
−2,402
|
−19.6
|
| woj. wielkopolskie |
−2,231
|
−15.9
|
| woj. śląskie |
−2,014
|
−24.5
|
| woj. opolskie |
−1,558
|
−19.1
|
| woj. podkarpackie |
−1,359
|
−5.6
|
| woj. lubelskie |
−1,054
|
−12.8
|
| woj. świętokrzyskie |
−625
|
−19.1
|
| woj. pomorskie |
−580
|
−4.7
|
| Baltic Sea |
−290
|
−51.0
|
| woj. łódzkie |
−141
|
−0.6
|
| Total |
−63,967
|
−25.7
|
Figure below shows changes in domestic resources and production of sand and gravel in Poland in the years 1989-2012.
Natural sand and gravel are also obtained during the exploitation of Brown coal. In 2012 from Bełchatów deposit the output of sand and gravel amounted to 121 thousand tonnes.
Prepared by: Wojciech Miśkiewicz, Dariusz Brzeziński, Janina Dyląg, Alina Piotrowska
2011
Two major groups of natural sand-gravel aggregates are differentiated: coarse aggregate group, comprising gravels and sand-gravel mix, and that of fine aggregates – comprising sands. Natural aggregates are used mainly in the building (concrete fill) and road construction (embankment and highway fill and road surfacing).
The demand for natural coarse aggregates is the largest, especially as distribution of their resources is far from uniform. The resources of natural coarse aggregates are generally small in central parts of the country, not covering the local demand.
The bulk of Polish natural aggregate deposits are of the Quaternary age. The share of deposits of the Pliocene, Miocene and Liassic age is subordinate.
The quality of raw material (especially its homogeneity) depends largely on genetic type of a given deposit. Deposits of fluvial origin clearly predominate in the Carpathian-Sudetic zone (southern Poland). In the Sudety Mts, the most common deposits are those of sandy-gravel higher terraces of the Pleistocene age, built mainly of detritus of sandstones and crystalline rocks. In turn, in the Carpathian region the raw material basis mainly comprises gravel and sandy gravel deposits occurring on flood-plain terraces as well as valley side terraces rising above flood plains. The Carpathian deposits are characterized by predominance of material coming from disintegration of flysch rocks, except for those of the Dunajec River valley, showing fairly high contribution of crystalline rocks from the Tatry Mts.
In northern and central Poland (Polish Lowlands region), the most important deposits are of glacial (accumulation platform of front moraine) and fluvioglacial (outwash plain and esker) origin and resulting from river accumulation. Deposits from northern part of that area represent gravel-sandy accumulations mainly comprising Scandinavian material – debris of crystalline rocks and limestones with admixture of quartz and sandstones. In central and southern parts of this region, the deposits are mainly formed of sandy sediments with significant share of debris of local rocks.
According to criteria of Polish classification of reserves/resources adopted in 2005, sand and gravel deposits should be characterized by content of grains of silt fraction below 15%, thickness not smaller than 2 m and the ratio of cover to deposit series not higher than 1.0.
Sand and gravel deposits occurence in Poland is presented on the map.
Table 1 shows resources and the current state of exploration and development of natural sand and gravel aggregates.
Anticipated economic resources of natural aggregates totaled 17,232.56 million tonnes in the end of 2011. This means an increase by 480.14 million tonnes in relation to the previous year. That was mainly due to 764 new deposits documented in 2011 with anticipated economic resources amounted to 710.5 million tonnes. The largest resources were documented in podkarpackie voivodeship (125.8 million tonnes within 134 new deposits), lubuskie voivodeship (78.6 million tonnes within 23 new deposits), łódzkie voivodeship (67.1 million tonnes within 106 new deposits), zachodniopomorskie voivodeship (62.5 million tonnes within 12 new deposits).
There were 192 deposits crossed out of the ‘Balance…’ with anticipated economic resources amounted to 31.7 million tonnes.
The table below shows changes within anticipated economic resources in particular voivodeships in 2011 (thousand tonnes).
| increase: | decrease: | |||||
| 1. | podkarpackie |
97,866
|
1. | podlaskie |
−1,715
|
|
| 2. | lubuskie |
72,486
|
2. | Baltic Sea |
−569
|
|
| 3. | łódzkie |
71,655
|
|
|||
| 4. | pomorskie |
53,354
|
|
|||
| 5. | zachodniopomorskie |
45,396
|
|
|||
| 6. | warmińsko-mazurskie |
33,138
|
|
|||
| 7. | mazowieckie |
33,02
|
|
|||
| 8. | dolnośląskie |
22,587
|
|
|||
| 9. | opolskie |
12,324
|
|
|||
| 10. | lubelskie |
10,909
|
|
|||
| 11. | wielkopolskie |
8,892
|
|
|||
| 12. | kujawsko-pomorskie |
6,744
|
|
|||
| 13. | małopolskie |
5,524
|
|
|||
| 14. | śląskie |
4,928
|
|
|||
| 15. | świętokrzyskie |
3,604
|
|
|||
| Total increase (+) |
482,431
|
Total decrease (−) |
−2,284
|
|||
The most deposits are located in mazowieckie (1,171), wielkopolskie (982), lubelskie (792), podkarpackie (744) and łódzkie (700) voivodeship.
Resources within deposits covered by detailed exploration (A+B+C1) amounted to 9,194.8 million tonnes and states for 53.4% of the total anticipated economic resources, with resources within deposits covered by preliminary exploration (C2) states for 46.6%. Resources within exploited deposits amounted to 4,714.38 million tonnes (27.4% of the total anticipated economic resources).
Economic resources amounted to 3,030.71 million tonnes and increased by 327.1 million tonnes in comparison with the previous year.
In 2011, production of natural sands and gravel rose to 248.7 million tonnes, increasing by 85.2 million tonnes, that is 52.2% in relation to the previous year. The production increased in 15 voivodeship (out of 16). The table below shows changes within production in particular voivodeships in 2011 (thousand tonnes).
| Increase of production |
%
|
|
| (thousand tonnes) | ||
| podkarpackie |
14,619
|
162.6
|
| łódzkie |
13,565
|
126.8
|
| kujawsko-pomorskie |
8,246
|
39.5
|
| mazowieckie |
8,147
|
55.4
|
| podlaskie |
7,301
|
49.4
|
| dolnośląskie |
7,169
|
44.5
|
| małopolskie |
6,463
|
44
|
| warmińsko-mazurskie |
6,02
|
81.2
|
| lubuskie |
4,073
|
58.7
|
| lubelskie |
3,057
|
52.4
|
| śląskie |
2,824
|
14.2
|
| wielkopolskie |
1,751
|
23
|
| opolskie |
1,524
|
24.3
|
| świętokrzyskie |
639
|
0
|
| zachodniopomorskie |
92
|
0.8
|
| pomorskie |
−810
|
−6.1
|
| Total |
85,248
|
52.2
|
Figure below shows changes in domestic resources and production of sand and gravel in Poland in the years 1989-2011.
Natural sand and gravel are also obtained during the exploitation of Brown coal. In 2011 from Bełchatów deposit the output of sand and gravel amounted to 486 thousand tonnes.
Prepared by: Alina Piotrowska, Janina Dyląg, Wojciech Miśkiewicz, Krzysztof Żukowski
 PGI-NRI offer
 Mineral resources of Poland
  Oil and Gas in Poland


 Subscribe to RSS Feed
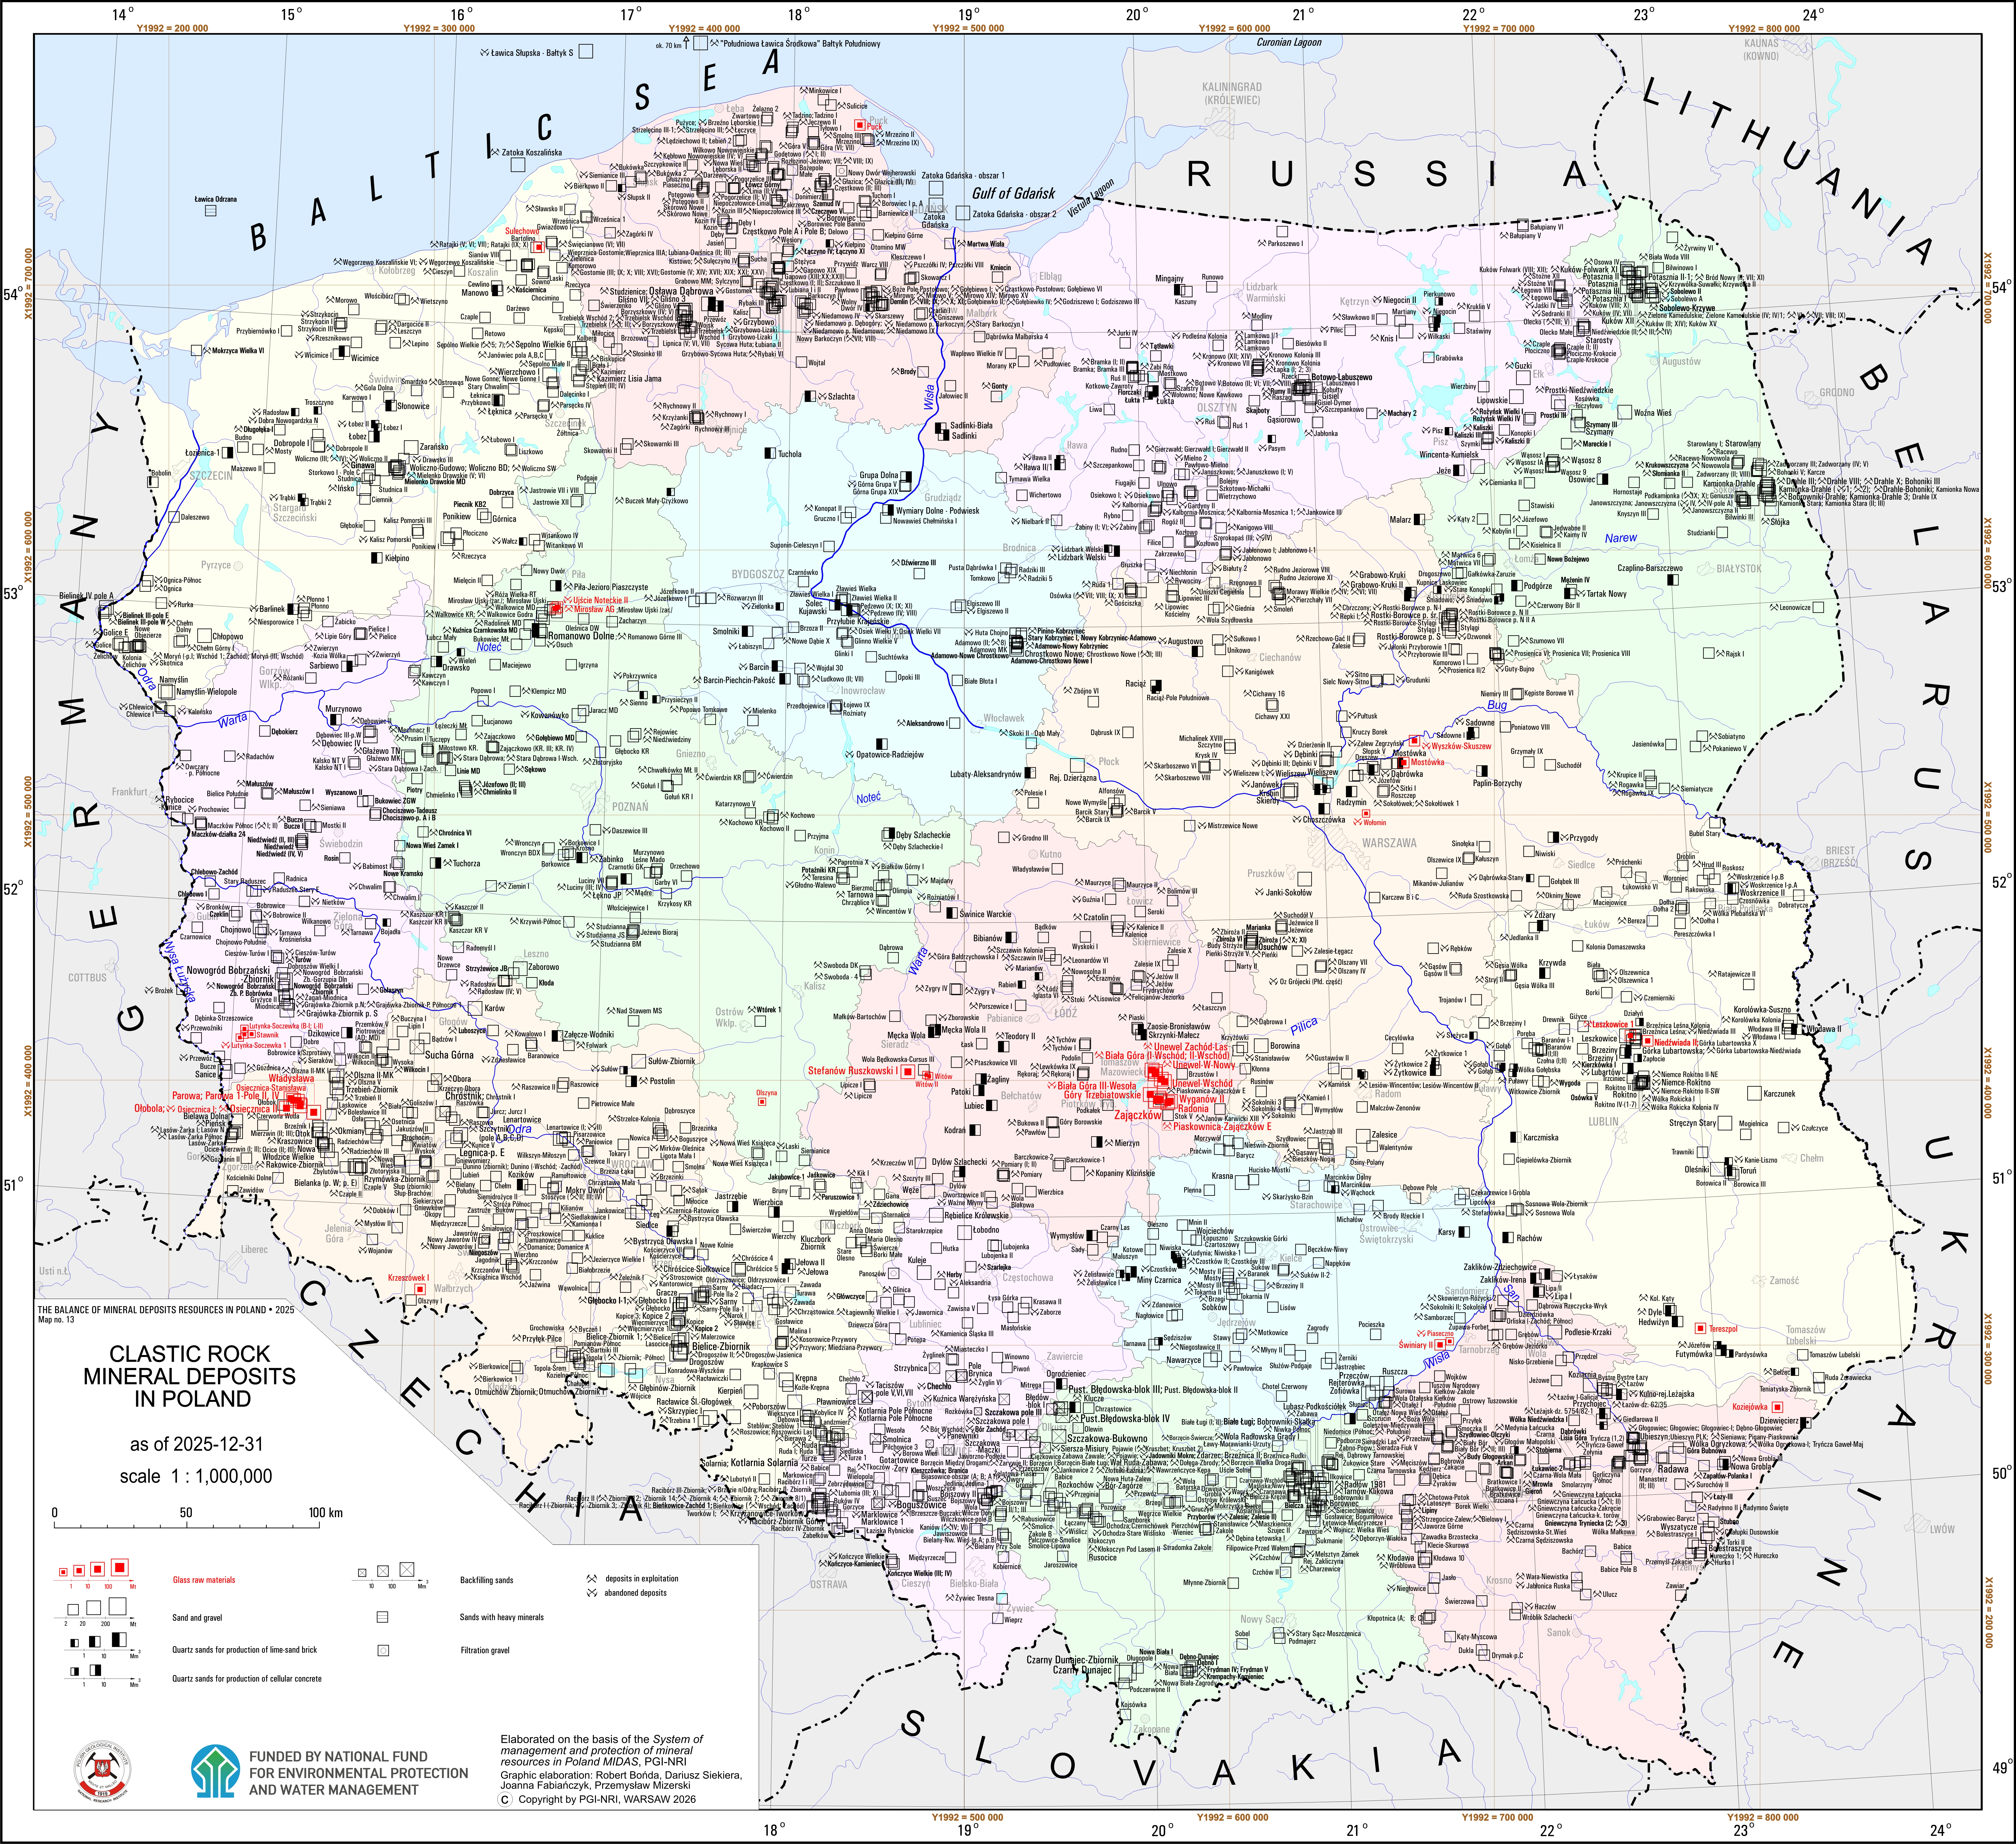